
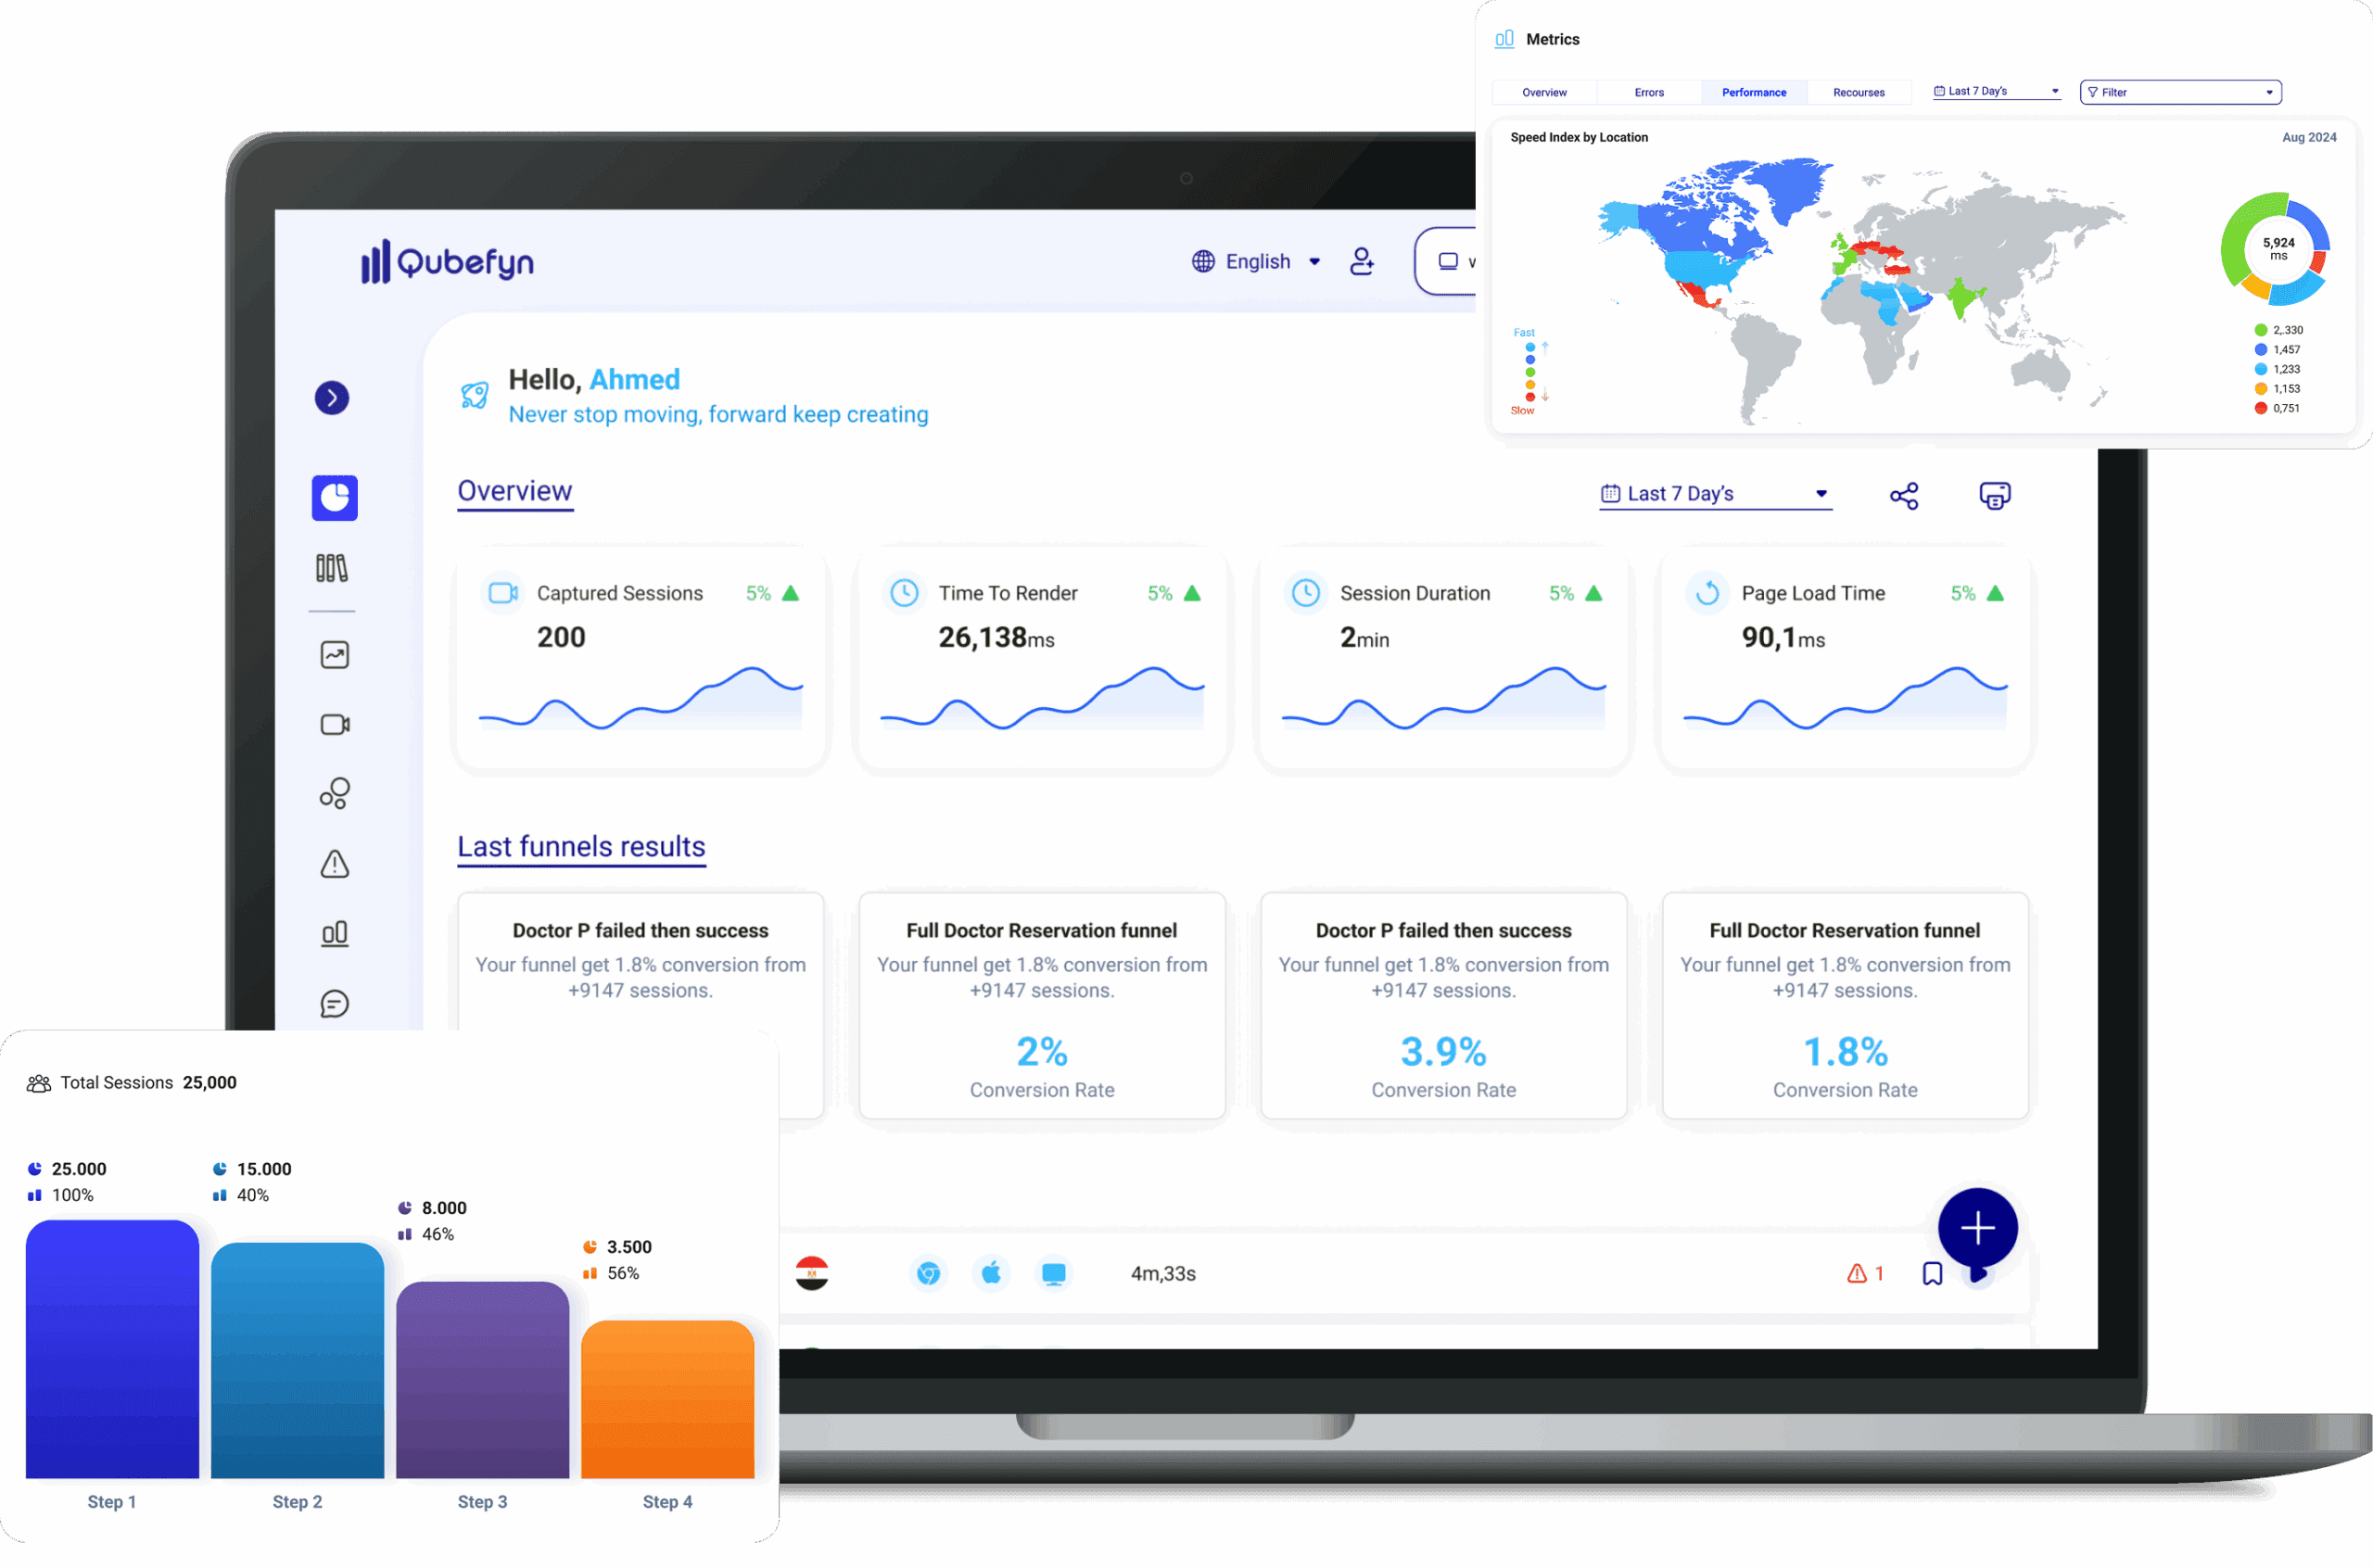
See where user attention goes
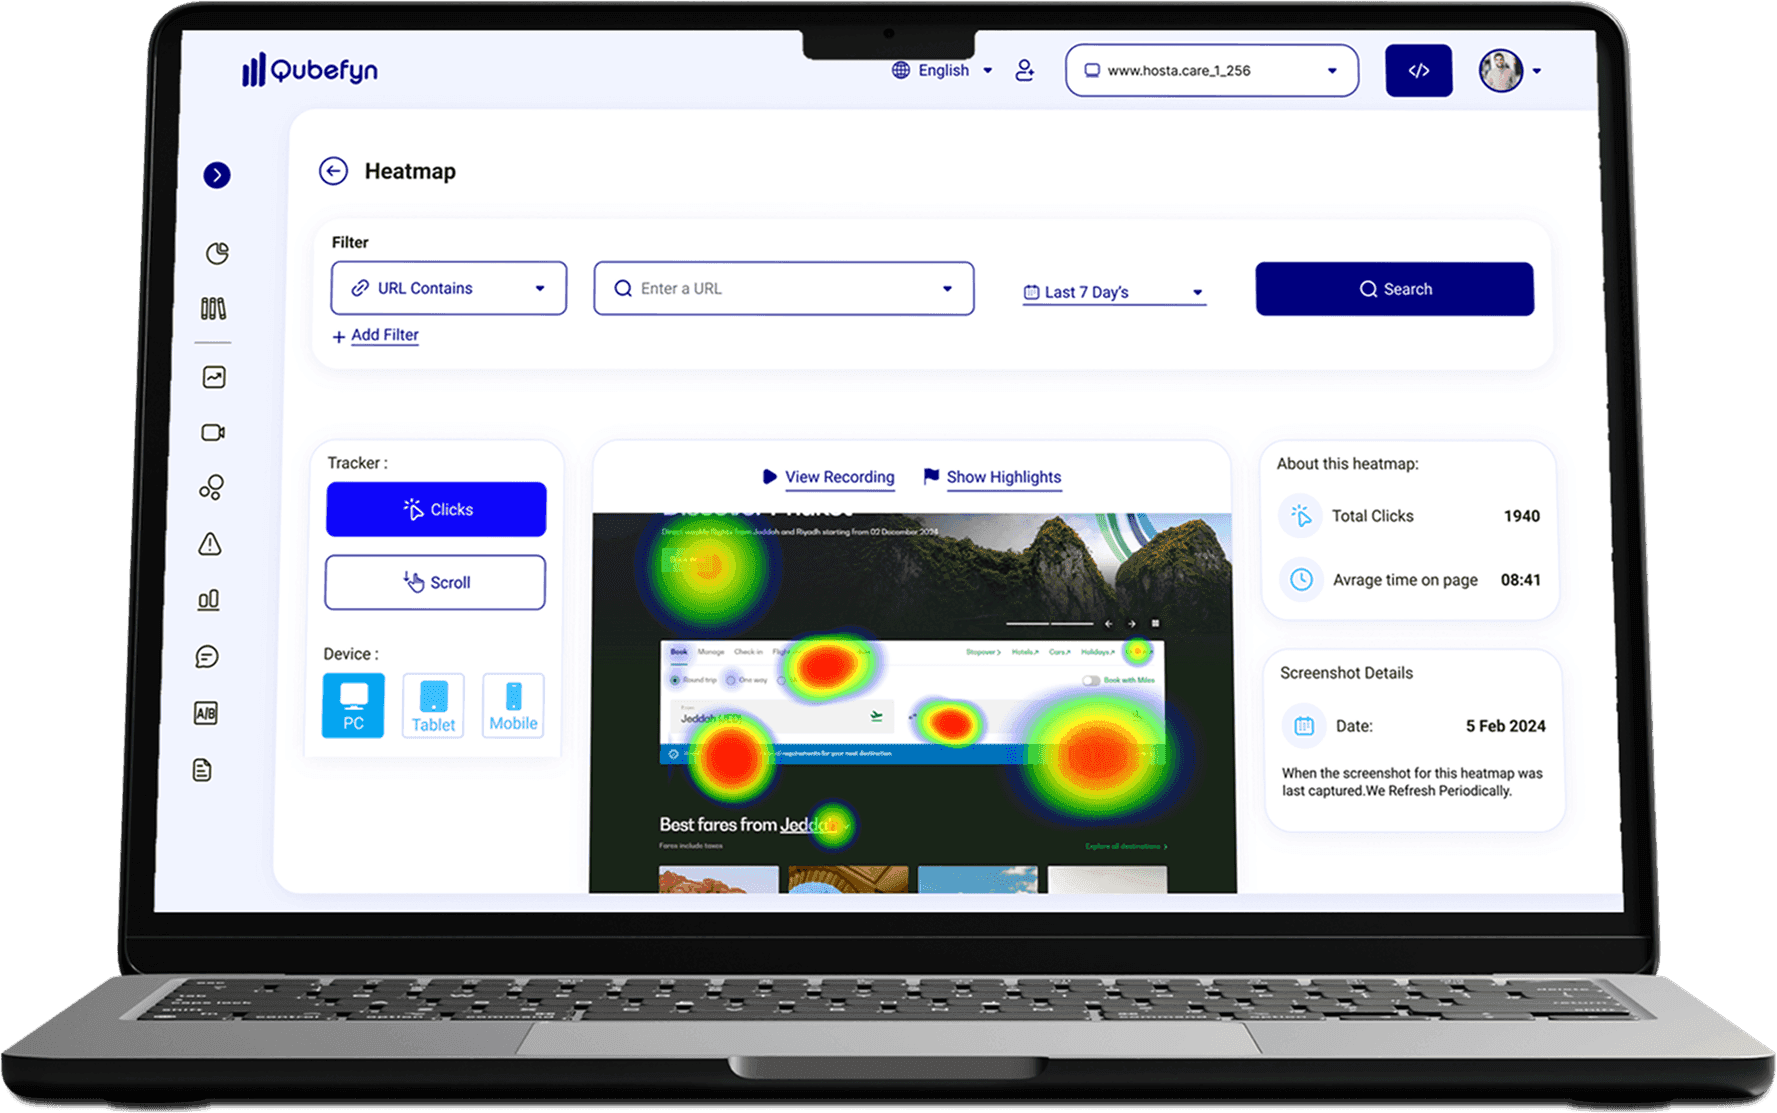
Click and scroll maps turn interaction into a visual layer, revealing influential elements, dead zones, and unexpected opportunities.
If this sounds familiar, there is still a signal you cannot see.
Important elements receive little engagement
Visitors do not finish reading the page
Clicks cluster in unexpected places
From a raw signal to insight you can use.
Every component is designed to turn data or daily activity into a clearer decision your team can act on and review.
Click maps
See what users believe is clickable and what attracts their attention.
Scroll maps
Identify how far audiences travel down the page before stopping.
Device comparison
Separate mobile, tablet, and desktop experiences instead of blending them into a misleading average.
What are Heatmaps in Qube Analytics?
Heatmaps visualize captured clicks, scrolling, and movement to show where attention appears concentrated and which areas receive less engagement.
Monitor where visitors click to build a better experience
Heatmaps show how visitors interact with your site, giving you behavioral evidence for improving the experience and page performance.
Design clarity matters
Unclear layouts can make it harder for visitors to find the content and actions they need.
See the page through the visitor's behavior
Combine click and movement patterns with available session context to investigate engagement and prioritize page improvements.
Clicks and average dwell time
See the number of clicks and average time visitors stayed on the page directly from the heat map without navigating to other pages. This information helps you understand visitor behavior and make better decisions to improve their experience.
Information about the session
Review available context such as visit date, device and browser type, and session duration to better understand the environment behind an interaction.
Filter data for faster access
Use filters to specify the exact URL, date range, or type of page you want to analyze. You can also use events to track a specific interaction, such as visiting a specific page or performing a specific step within a session.
Session table
Captured sessions that match your scope appear in a searchable table with available context and page-based filters.
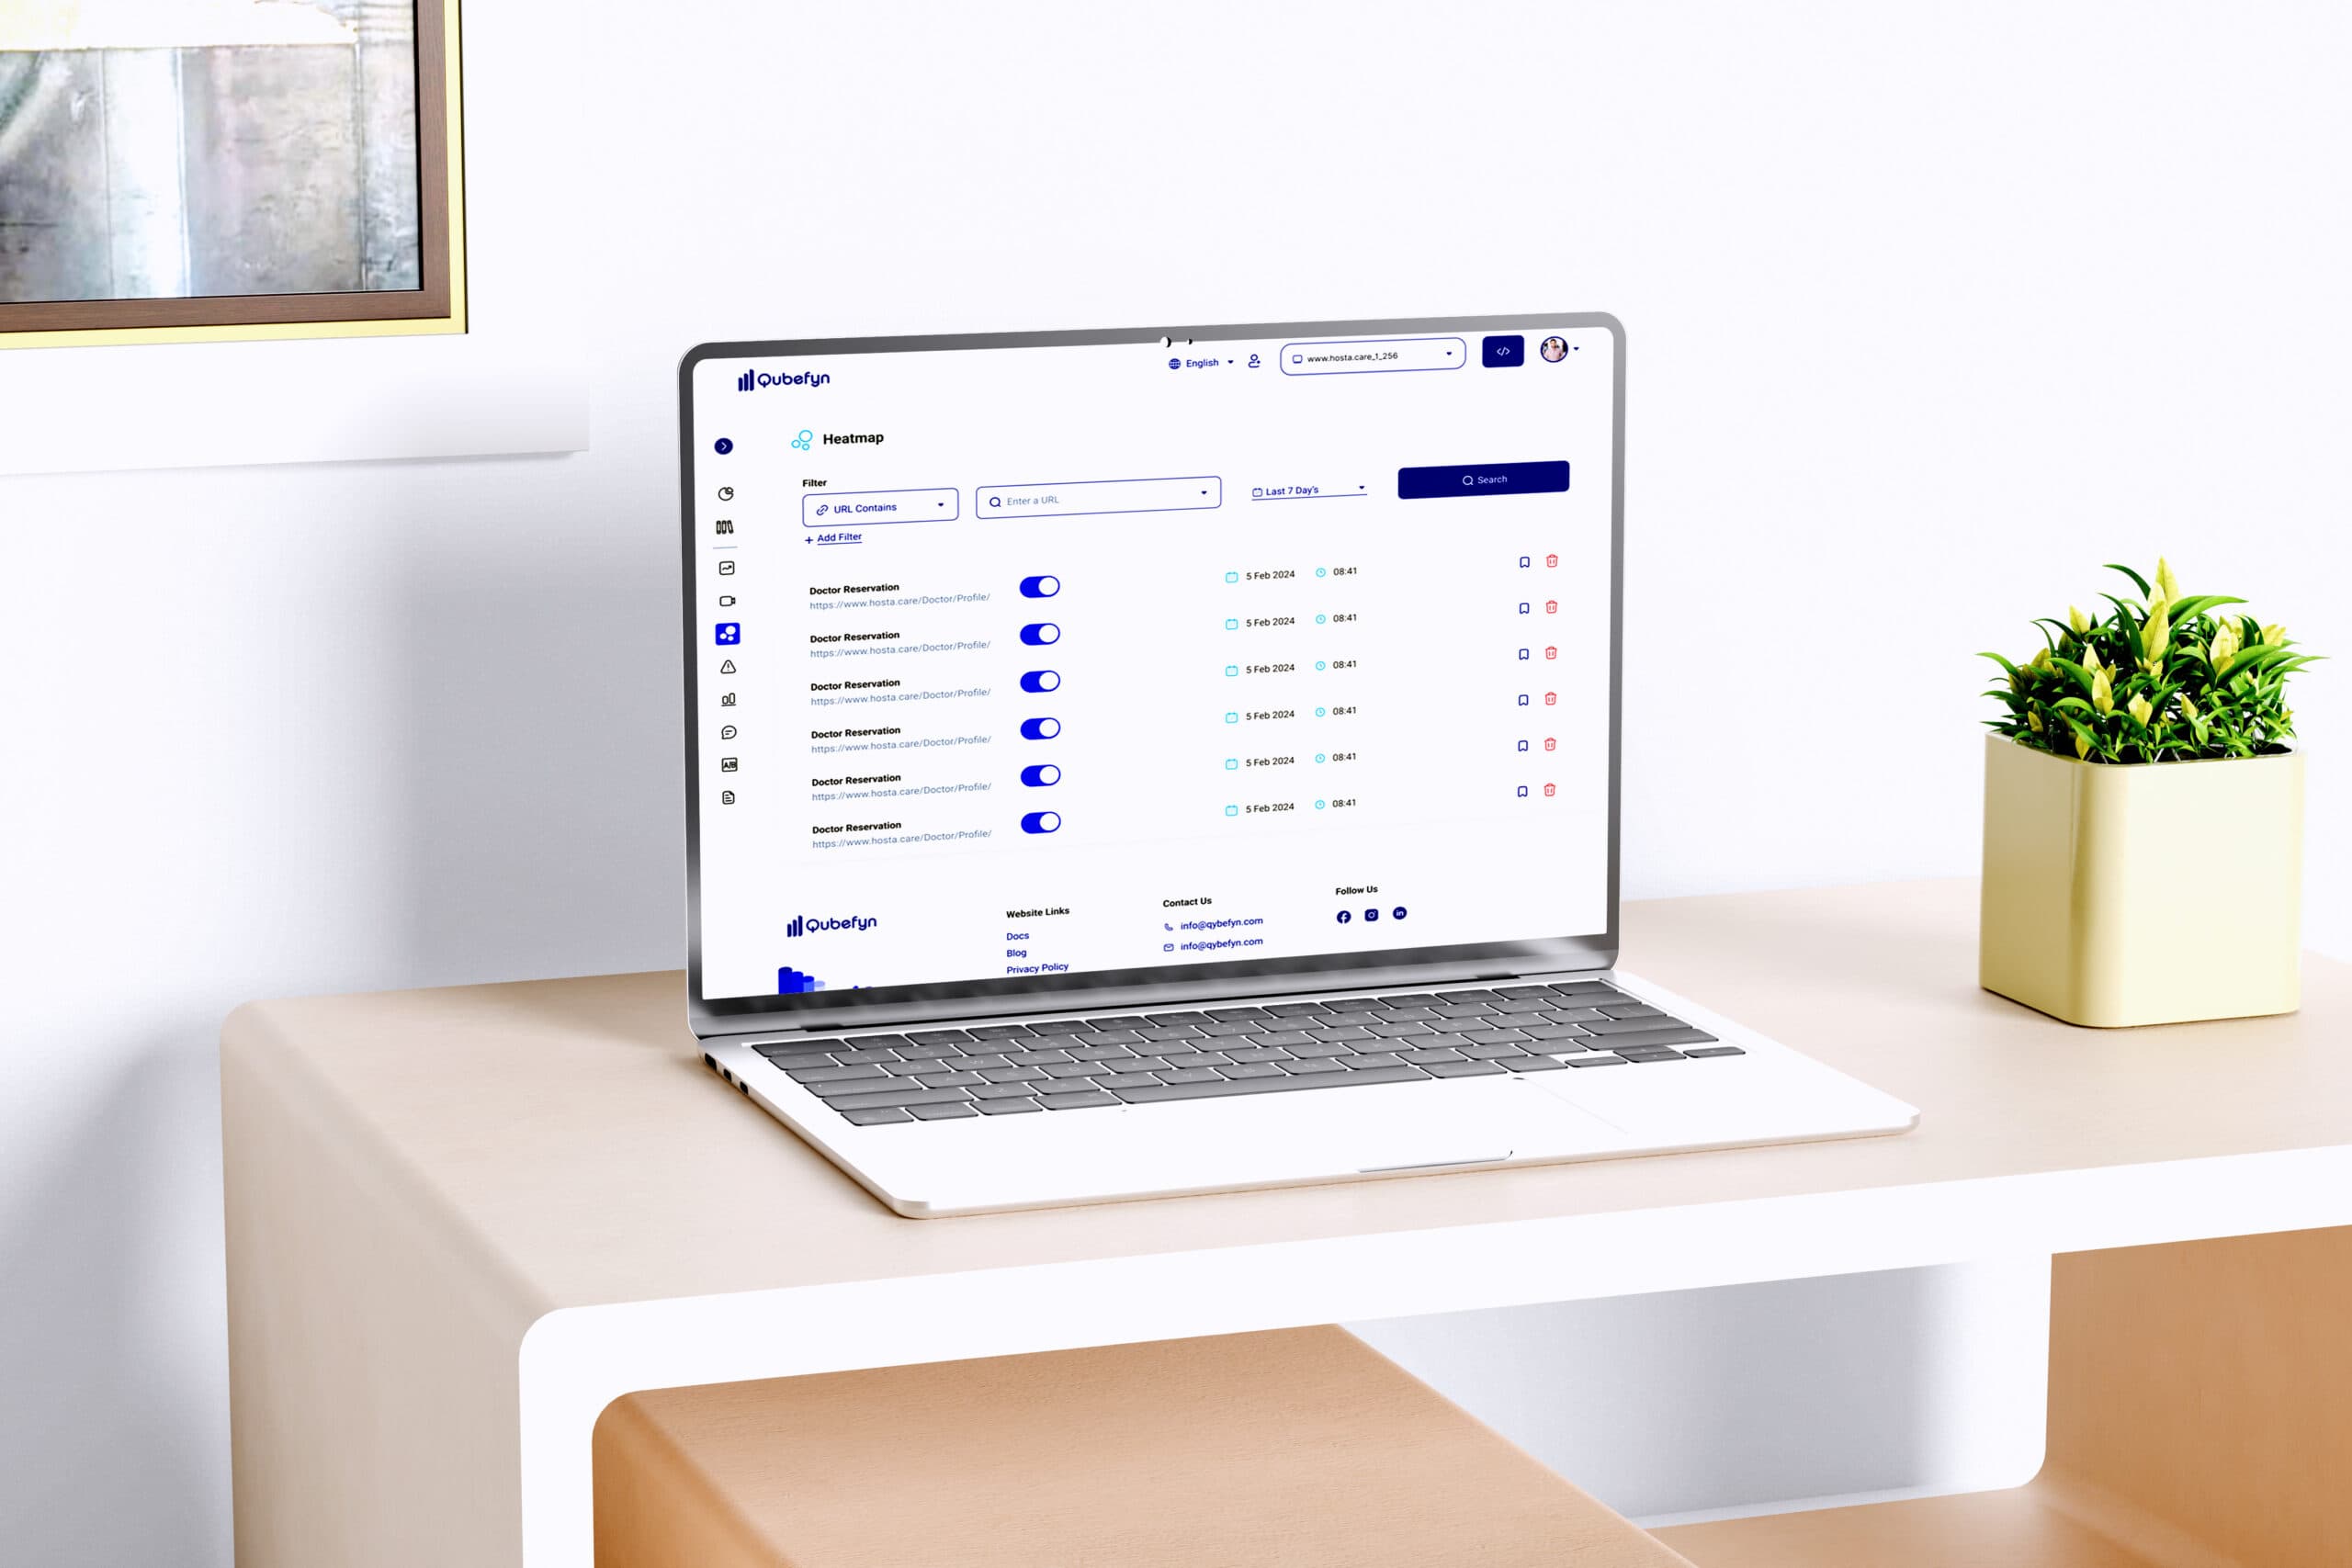
Qube Analytics click and scroll heatmaps — original product view 1
How heatmaps support site performance
Heatmaps provide a visual view of how visitors interact with your site. By tracking where visitors click, scroll, and move, you can identify the parts that attract attention and the parts that are overlooked.
Users not interacting with important items?
Reveal important elements that do not get the expected interaction on the page.
Visitors do not finish reading the page?
Find out where scrolling stops and visitors leave.
Clicks randomly distributed?
Watch the distribution of clicks to see if the design clearly draws attention.
Are there unexpected hot spots?
Discover elements that attract attention even though they are not within the intended path.
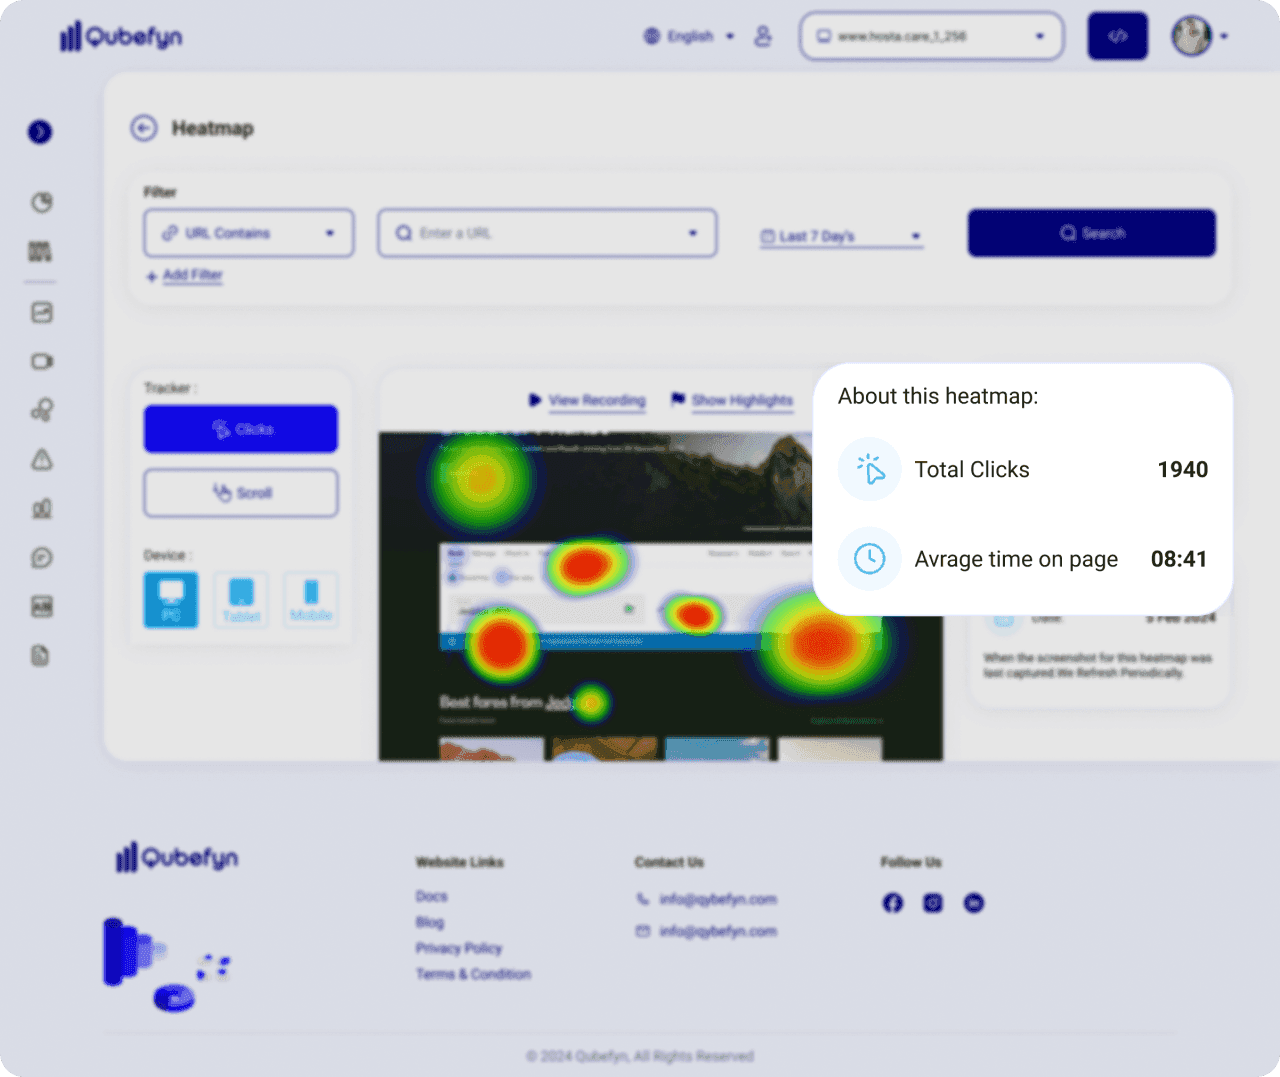
Qube Analytics click and scroll heatmaps — original product view 2
How heatmaps help you make smarter decisions
Heatmaps show how visitors interact with each part of a page, helping you identify what catches their attention and what they ignore. Use that evidence to refine the design and conversion journey.
Focus on areas that visitors interact with
Identify the most engaging parts of the page, and place the most important content in places that attract attention.
Get rid of ineffective items
Find out which sections are getting no engagement, and remove them or replace them with more impactful elements.
Improve the design based on user behavior
Rely on real, visual data rather than guesswork, and adjust pages based on actual user behavior.
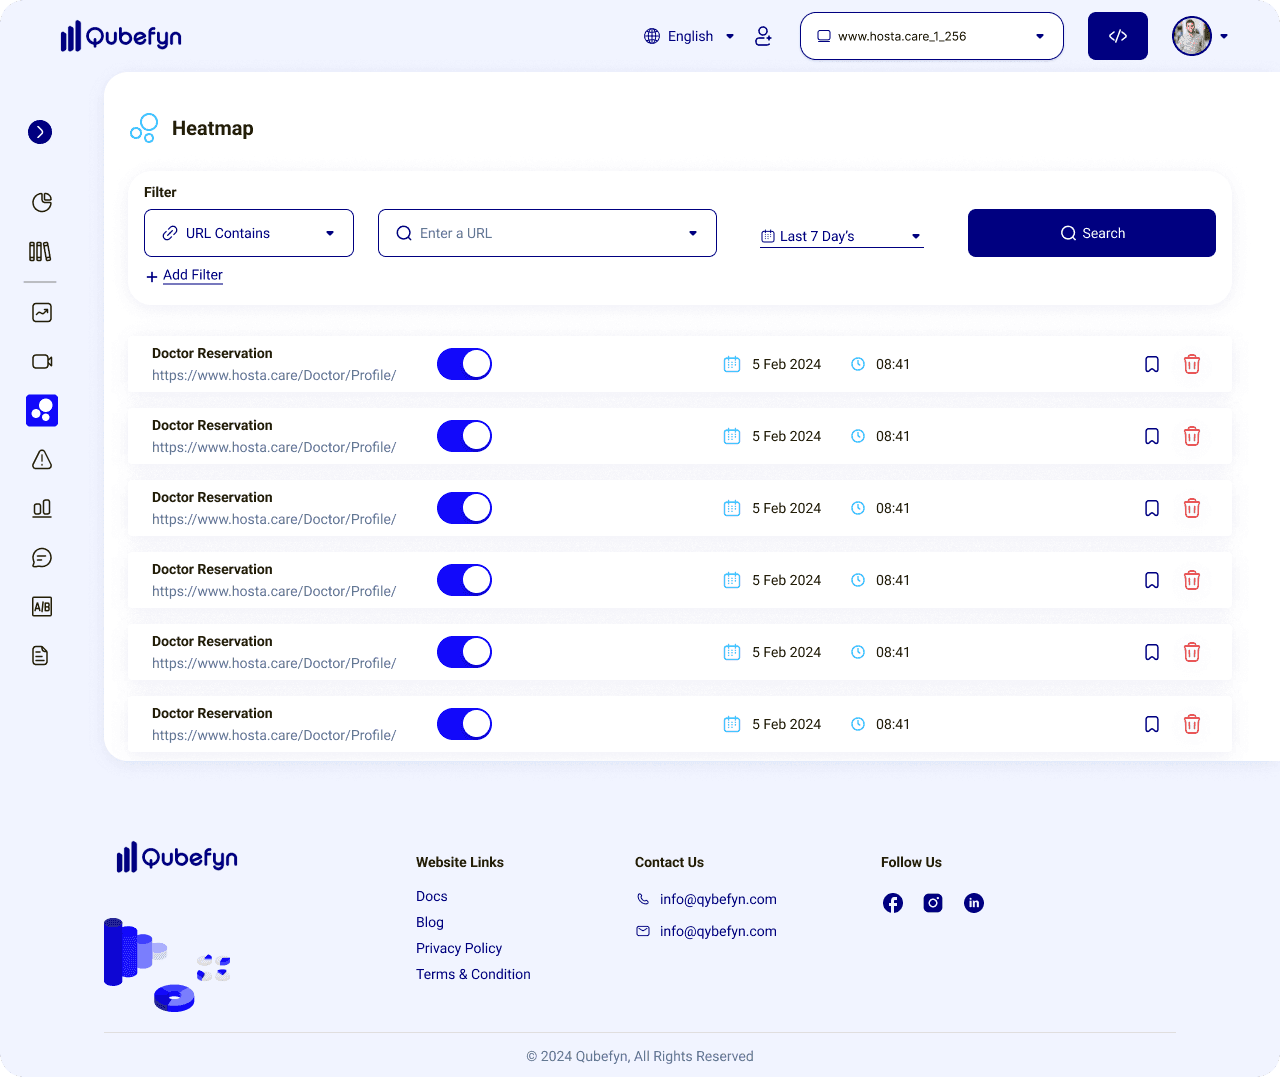
Qube Analytics click and scroll heatmaps — original product view 3
Frequently asked questions about heatmaps
Answers about setup, live data, reporting, and evaluation access.
01Does the heatmap require complex technical setup?+
Setup uses a small tracking snippet, after which data begins appearing automatically. Validate the snippet's performance in your own production environment.
02Can I track user behavior on specific pages only?+
Yes, you can choose exactly which pages you want to monitor, whether the landing page or a specific product page.
03Can the data be viewed in real time?+
Captured movement and click data can appear in current views, subject to collection and processing intervals.
04Do I need technical experience to use heatmaps?+
No. The visual interface is designed for product, design, and marketing teams without requiring code.
05Can reports be exported?+
Yes, you can download data for analysis or share reports with your team.
06Is there a free trial period?+
An evaluation option may be available so you can explore the tool before choosing a plan; confirm the current terms when you start.
Let us connect the challenge to the right solution.
A short session to understand the context and identify the first experiment that can demonstrate real value.