
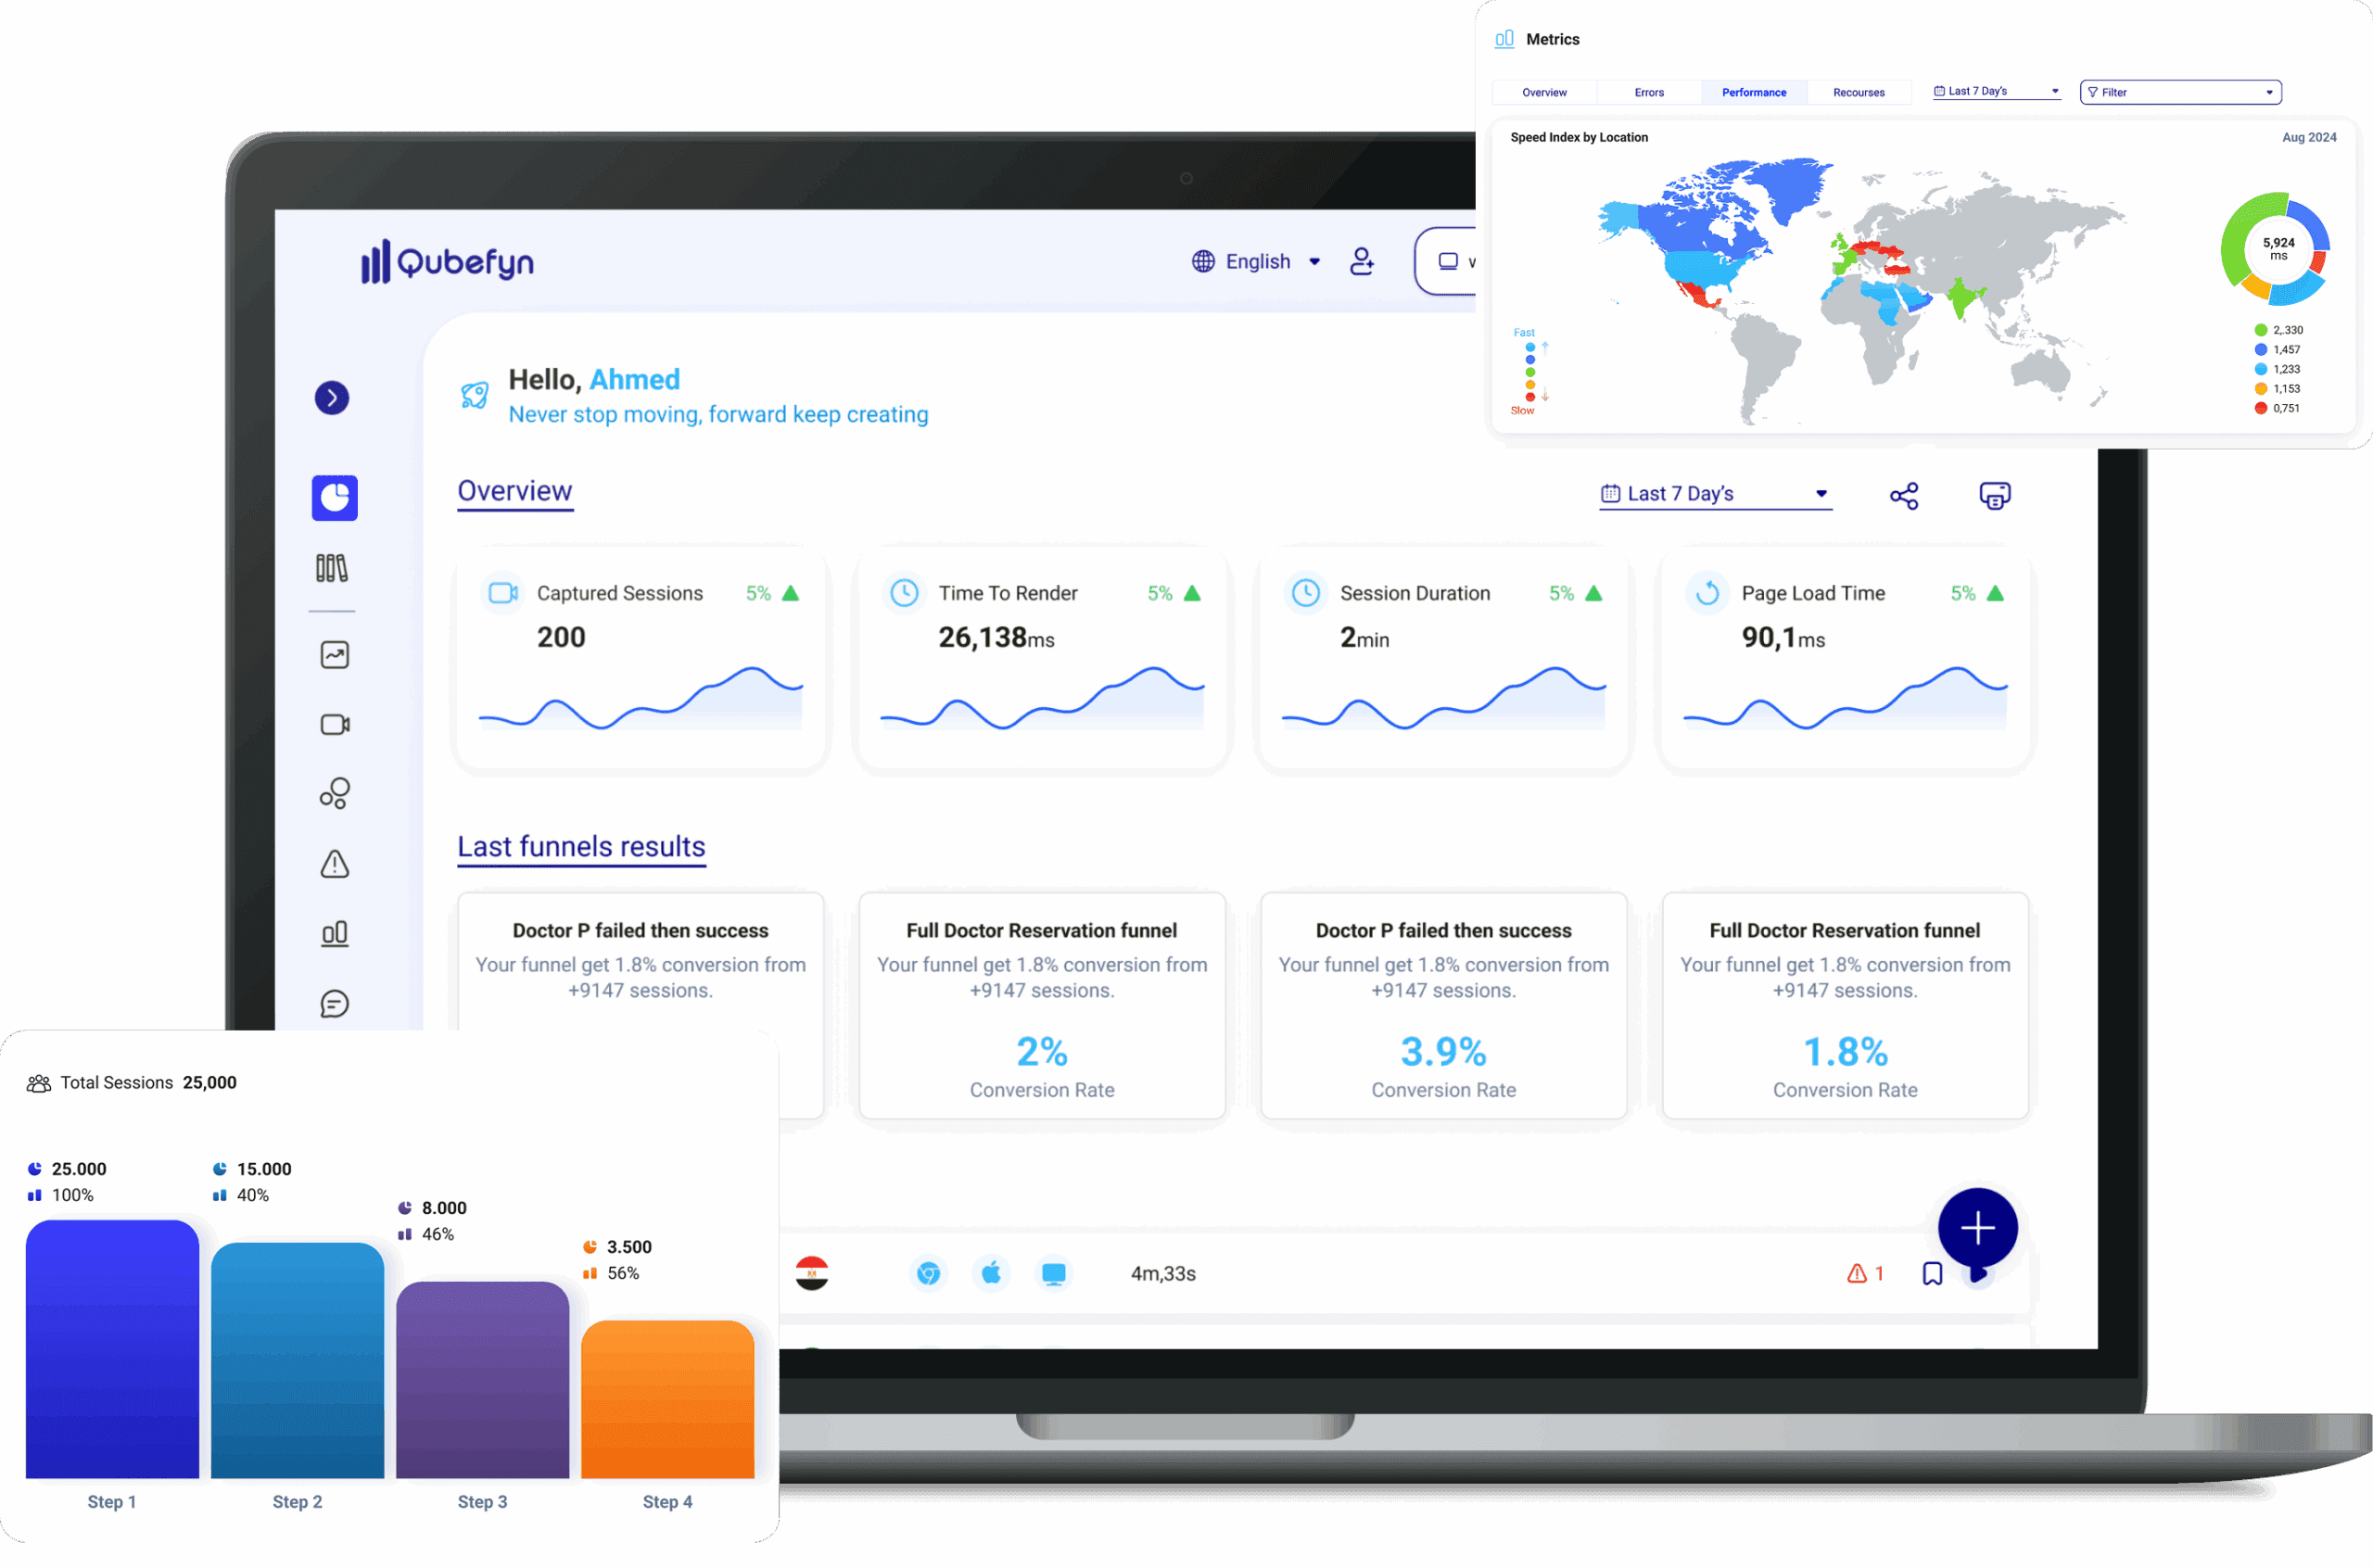
Every click tells a story. See the whole story.
An analytics platform that brings behavior, performance, errors, and customer voice into one view, helping your team understand what is happening, why, and what to do next.
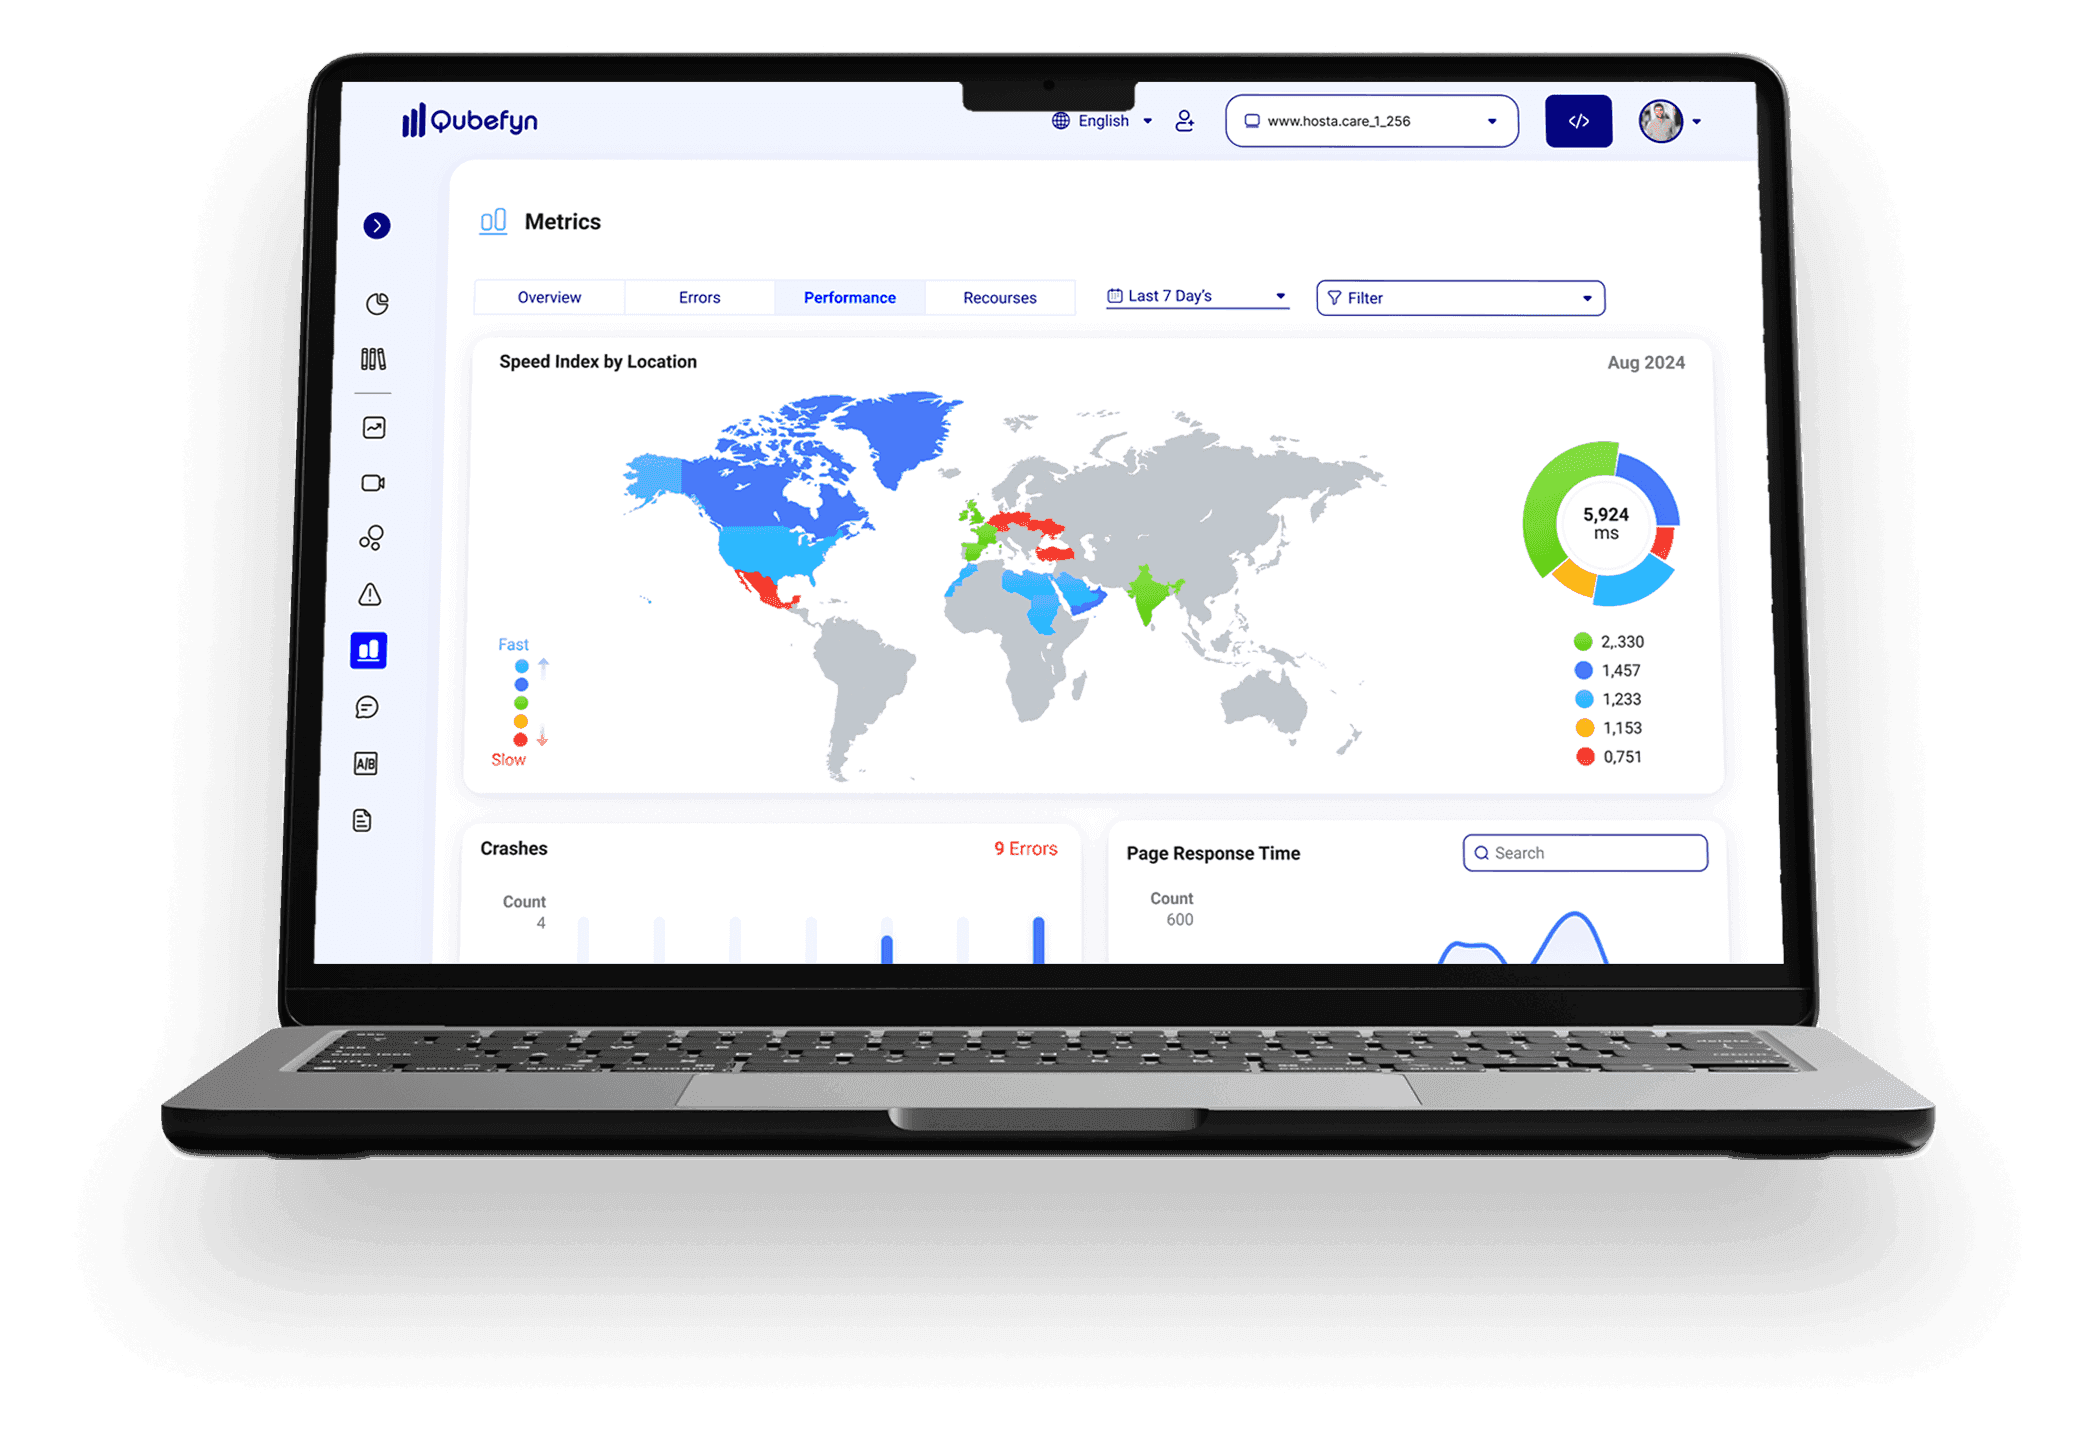
Capabilities that work together, not isolated tools.
Every component is designed to turn data or daily activity into a clearer decision your team can act on and review.
Behavior you can see
Heatmaps and session recordings reveal what tables alone cannot show.
Conversion you can improve
Clear funnels identify drop-off steps and the pages that need attention.
Performance you can trust
Technical metrics and errors connected to the real context of each session.
Decisions shaped with customers
Surveys, feedback, and experiments help you test a hypothesis before scaling it.
Why teams choose Qube Analytics
Explore how visitors move through key journeys, from early interactions to conversion or exit. Qube Analytics brings behavioral signals together so teams can find friction and prioritize improvements.
Funnels analysis
Follow key conversion paths step by step. Identify friction and explore why visitors may leave before completing a purchase or registration.
Identify and fix errors
Surface captured application errors and browsing issues alongside user context so development teams can investigate them more efficiently.
A/B testing
Run A/B tests to compare versions of a page, button, or other interface element, then use the results to understand which variant better supports your chosen goal.
User sessions (Session Recording)
Review captured user journeys to investigate friction, technical issues, and browsing patterns that may affect conversion.
Metrics and dashboards
Follow the performance indicators that matter to your team through configurable dashboards for visits, conversions, bounce rates, and related metrics.
Surveys
Create targeted surveys on or beyond your site to learn about customer needs and preferences, then use responses to inform products, services, and marketing.
Heatmaps
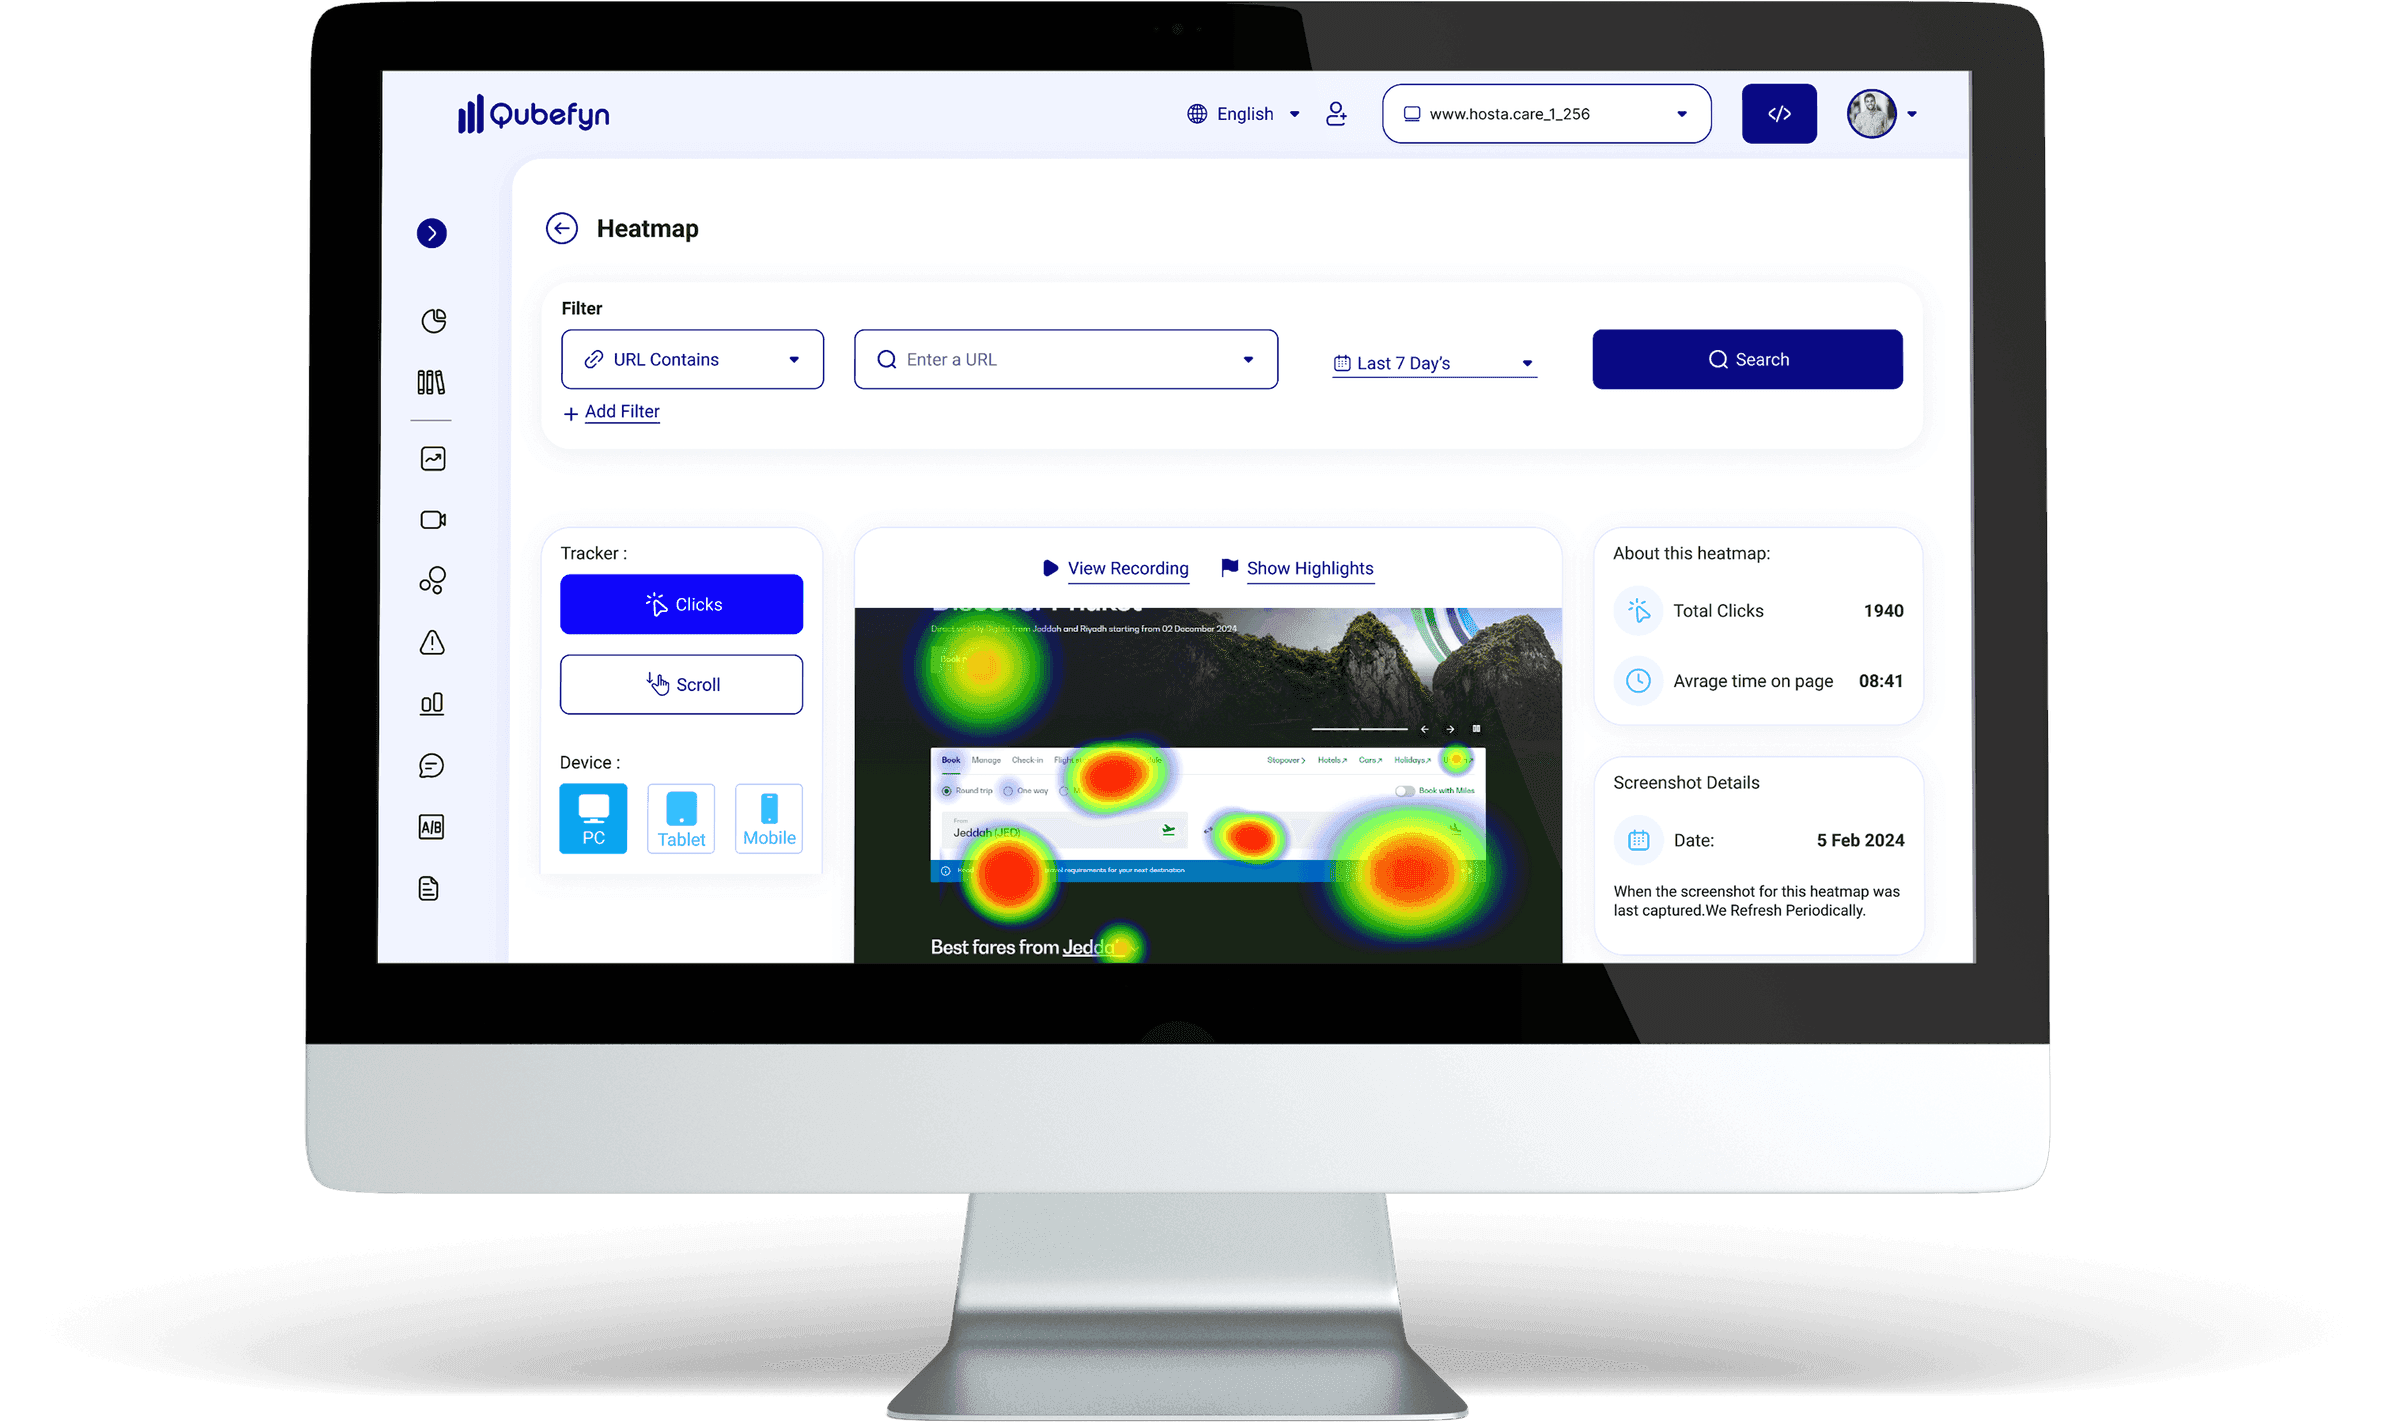
See where visitors click, move, and stop so you can identify engaging elements, overlooked areas, and opportunities to improve the user experience.
User opinions (Feedback)
Give visitors a direct channel for feedback on content, design, or problems they encounter, and organize those responses into actionable themes.
A clear view of the signals that matter
Audience size
Find out how many users are browsing your site.
Geographical location
Find out from which country visitors come to your platform.
Important actions
Monitor the percentage of visitors who completed important actions on your site.
Traffic from search
Learn which search engines attract visitors to your site.
Unified interface
Bring key statistics together in one clear interface.
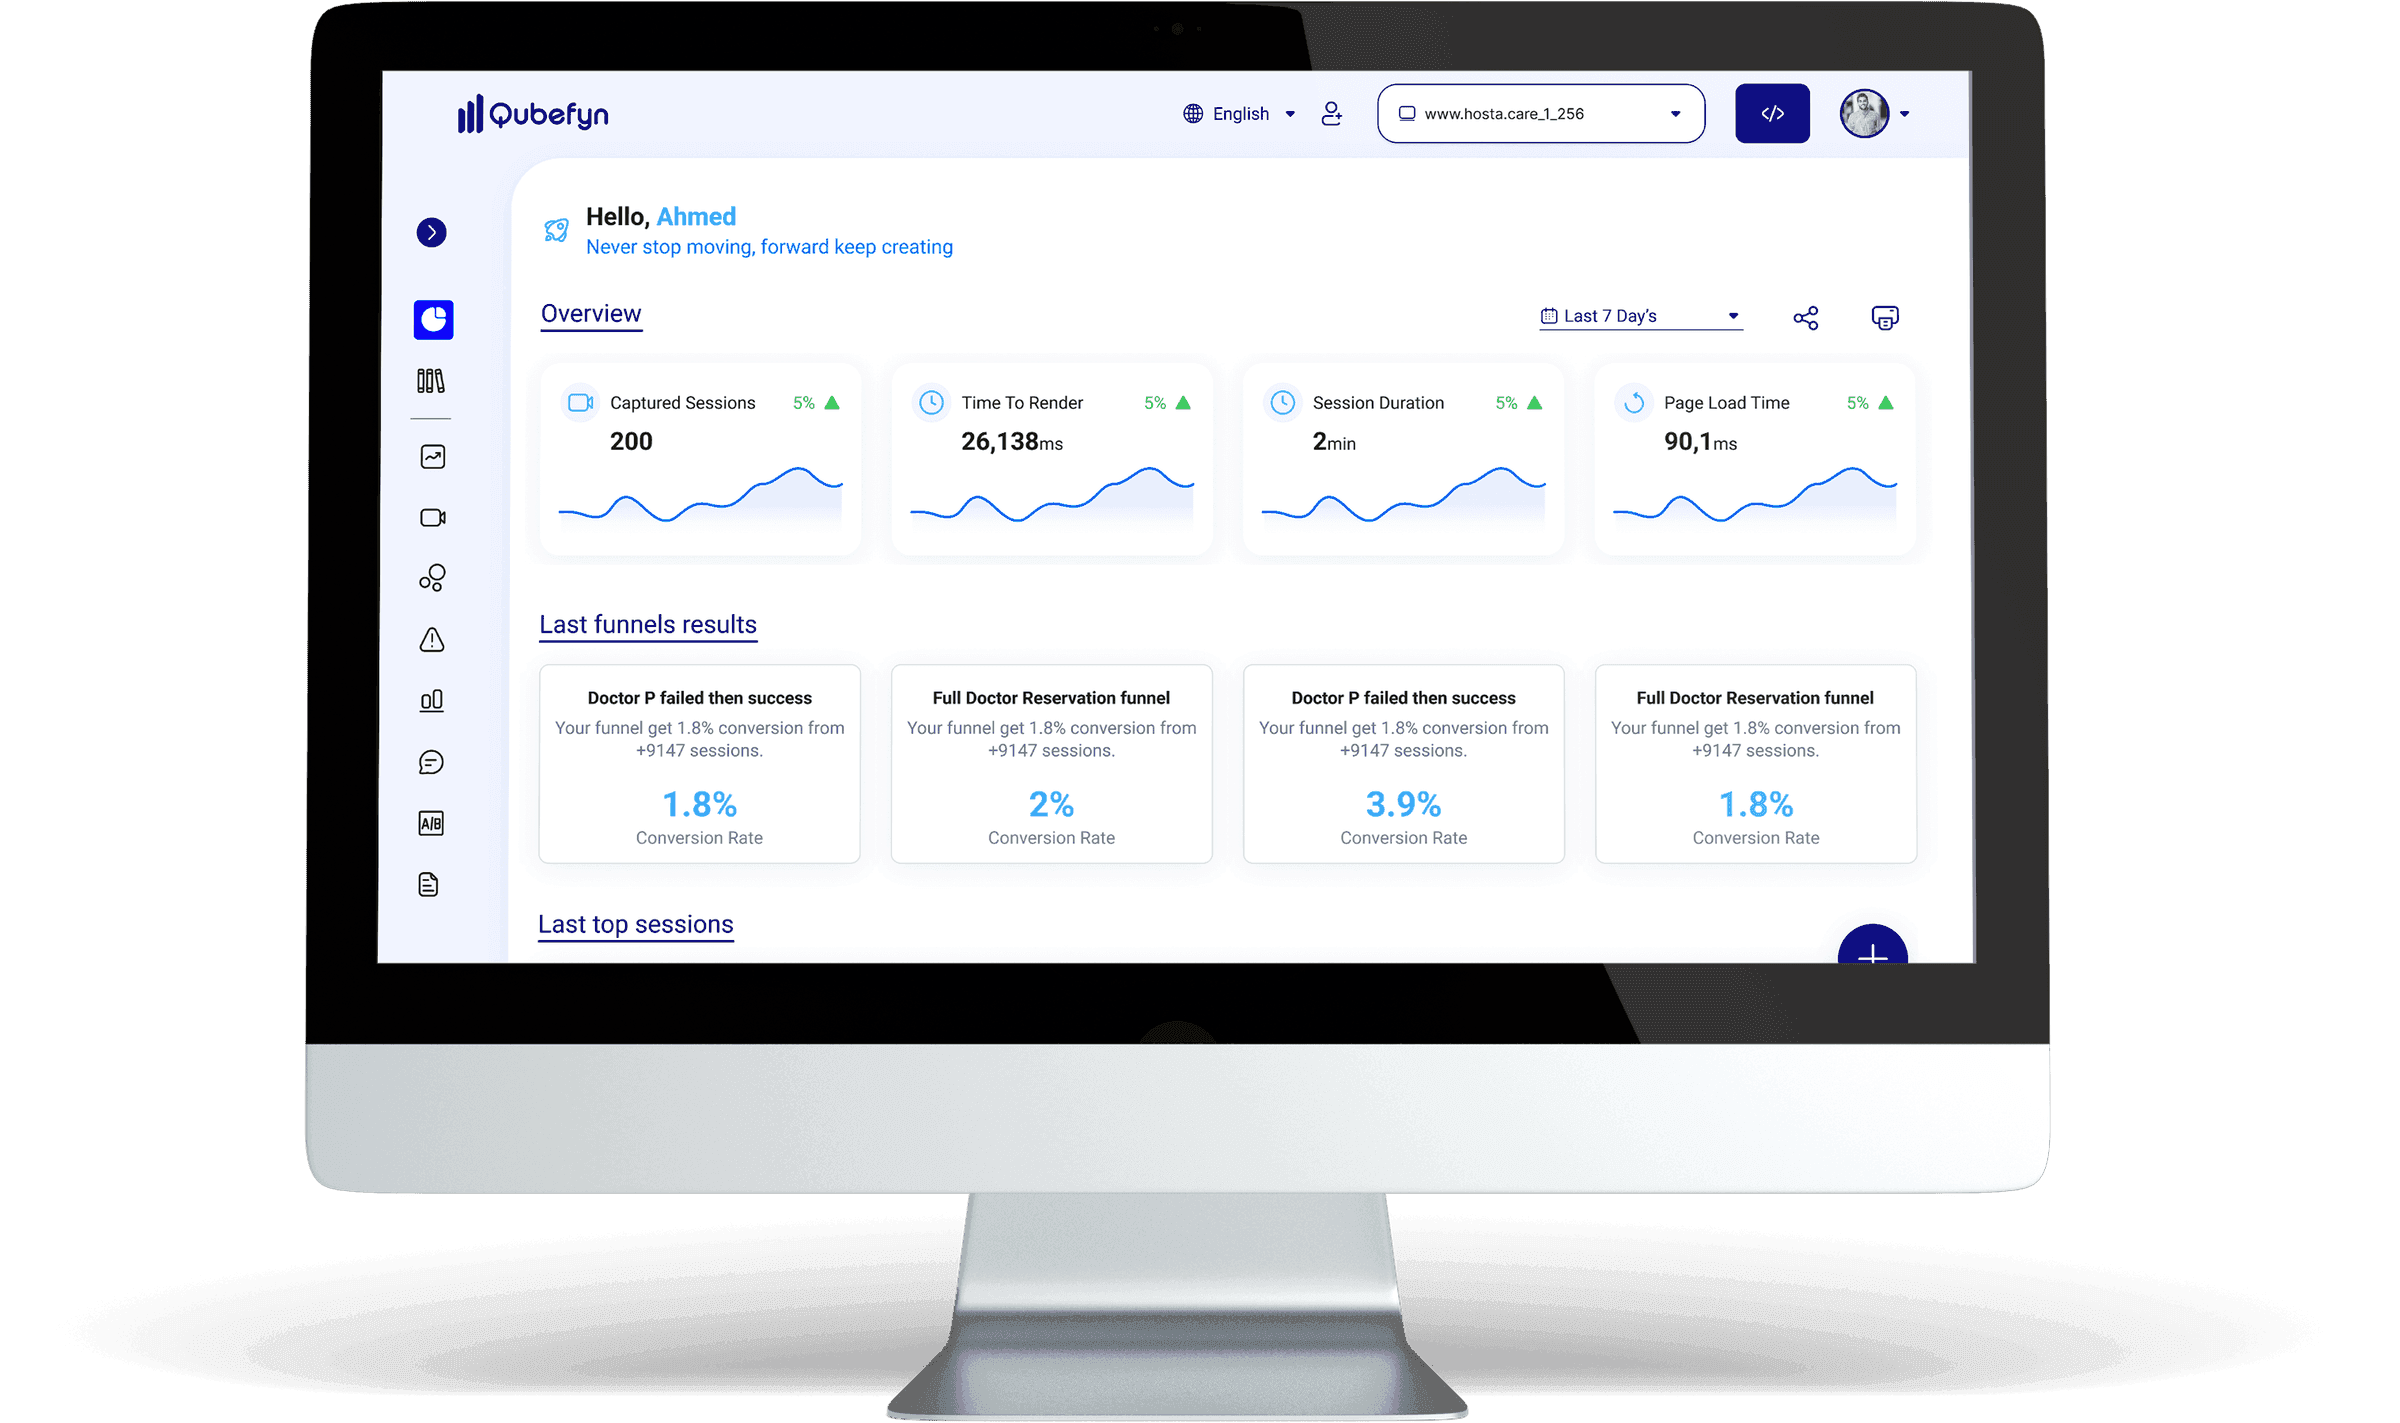
Qube Analytics interfaces for behaviour and performance analysis — original product view 1
Understand how visitors interact with your site visually
Click locations
See where visitors click and interact on your pages.
Attention and overlooked content
Learn what users pay attention to and what they ignore.
Live visual display
Get a visual view of visitor behavior without having to manually analyze data.
Compare devices
Monitor the difference in interaction between computer, phone and tablet users.
Better element placement
Use data to improve the placement of buttons and interactive elements on your site.
Make informed decisions by testing different experiences
Compare designs
Compare designs to see which performs more strongly against the selected goal.
Identify the stronger variant
Find out which copy gets the most interactions or conversions.
Choose with evidence
Rely on the numbers to choose the most appropriate design or content.
Improve gradually
Progressively modify your interface based on test results.
Straightforward launch
Use a focused setup flow to launch an experiment without writing code.
Qube Analytics interfaces for behaviour and performance analysis — original product view 2
Who can benefit from Qube Analytics?
Flexible solutions to suit different business activities.
Website owners
Monitor site performance and improve engagement.
Marketing teams
Evaluate campaigns using current performance signals.
UX and interface designers
Understand how the user interacts visually.
Product managers
Make data-based decisions.
Ecommerce teams
Understand purchase journeys and find conversion friction.
Developers and programmers
Identify errors and improve the user experience.
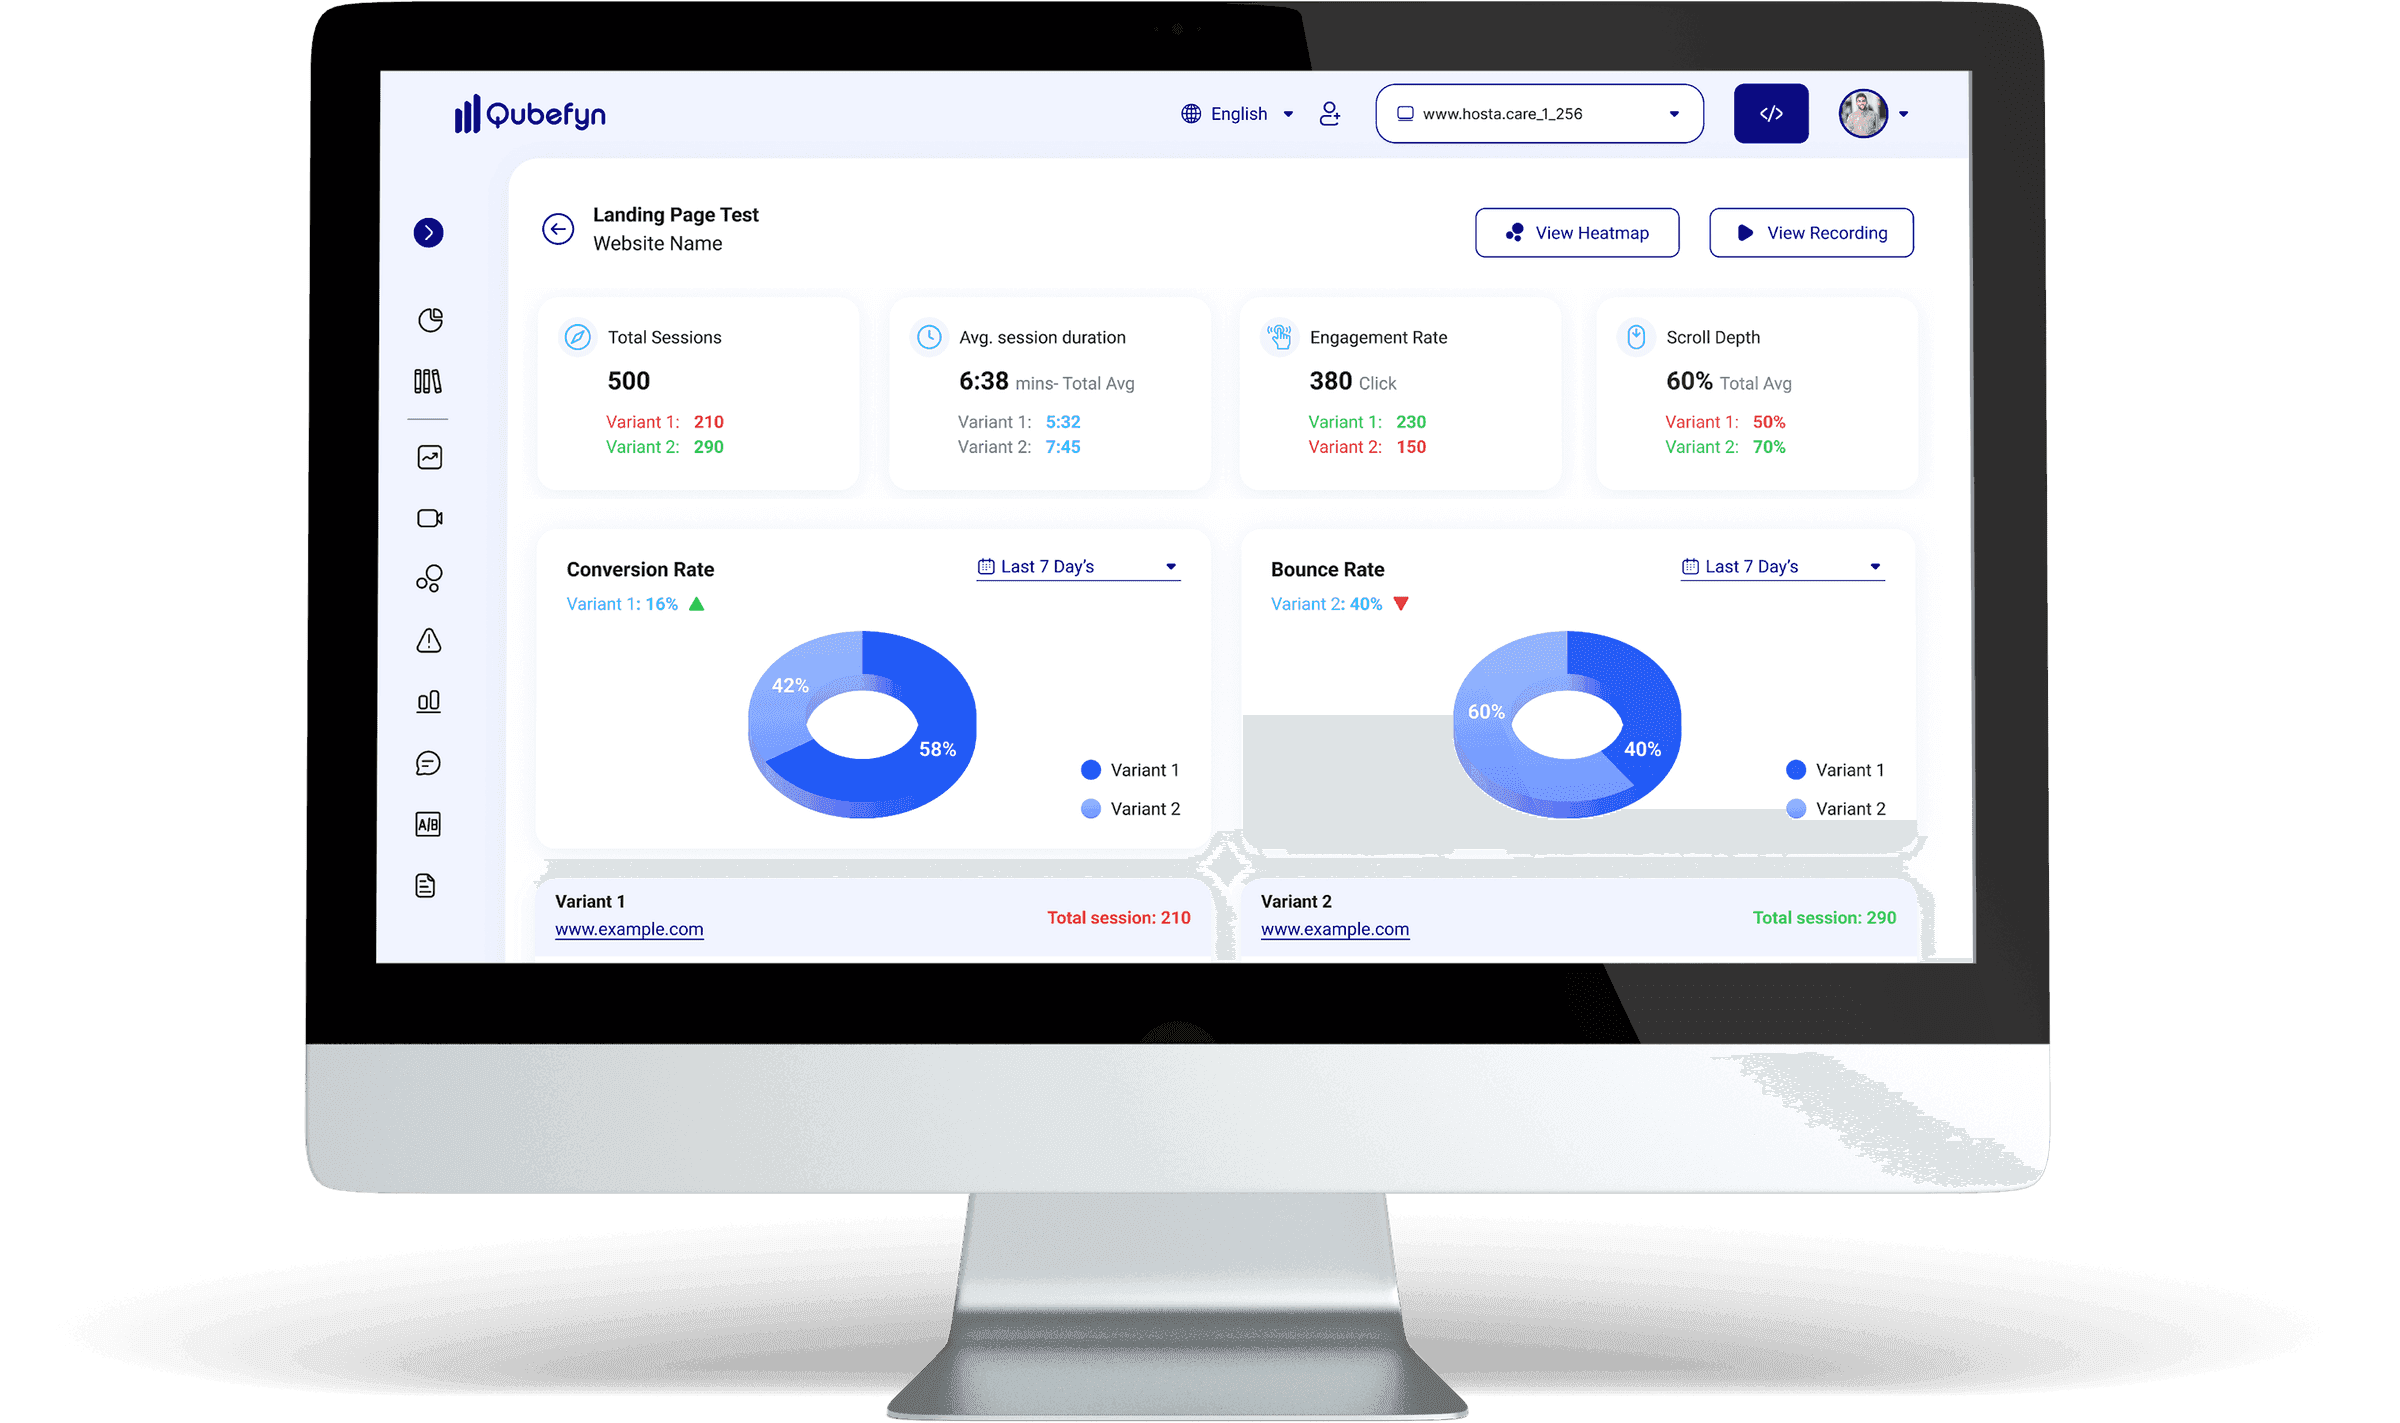
Qube Analytics interfaces for behaviour and performance analysis — original product view 3
Get ready to evaluate Qube Analytics
Guided installation
A focused setup flow helps teams move from installation to their first useful signals.
Data protection controls
The platform is designed with safeguards intended to protect your data throughout the experience.
Managed product updates
Product updates are managed through the service so teams can adopt improvements with less operational work.
Ongoing technical support
The support team is available to help during implementation and continued use.
Designed for different industries
A flexible platform that can support teams across a range of business sectors.
Ease of use without technical experience
A simple and easy interface that helps you achieve your goals without the need for a technical background.
Shared value, in every team's language.
Everything you need to know about Qube Analytics
Straightforward answers on usage, integration, performance and free trial.
01Do I need technical experience to use Qube Analytics?+
No. The platform is designed for marketers, website owners, product teams, and designers without requiring programming experience.
02Can I see visitors while they're browsing my site?+
You can review eligible captured sessions to see navigation, clicks, pauses, and exit points, subject to your recording, consent, and privacy configuration.
03Does Qube Analytics affect site speed?+
The tracking code is designed to be lightweight and run in the background. As with any analytics script, teams should validate performance in their own production environment.
04What is the difference between Qube Analytics and Google Analytics?+
Google Analytics is commonly used for traffic and acquisition reporting, while Qube Analytics adds behavioral tools such as session recording, heatmaps, and interaction analysis. The right mix depends on your measurement needs.
05Can I try Qube Analytics for free?+
A free evaluation option may be available so you can explore the platform before choosing a paid plan; confirm the current scope when you start.
06Can Qube Analytics be integrated with other platforms?+
Yes. Qube Analytics can connect with work-management tools such as ClickUp as well as marketing and advertising platforms through supported integrations.
Let us connect the challenge to the right solution.
A short session to understand the context and identify the first experiment that can demonstrate real value.