
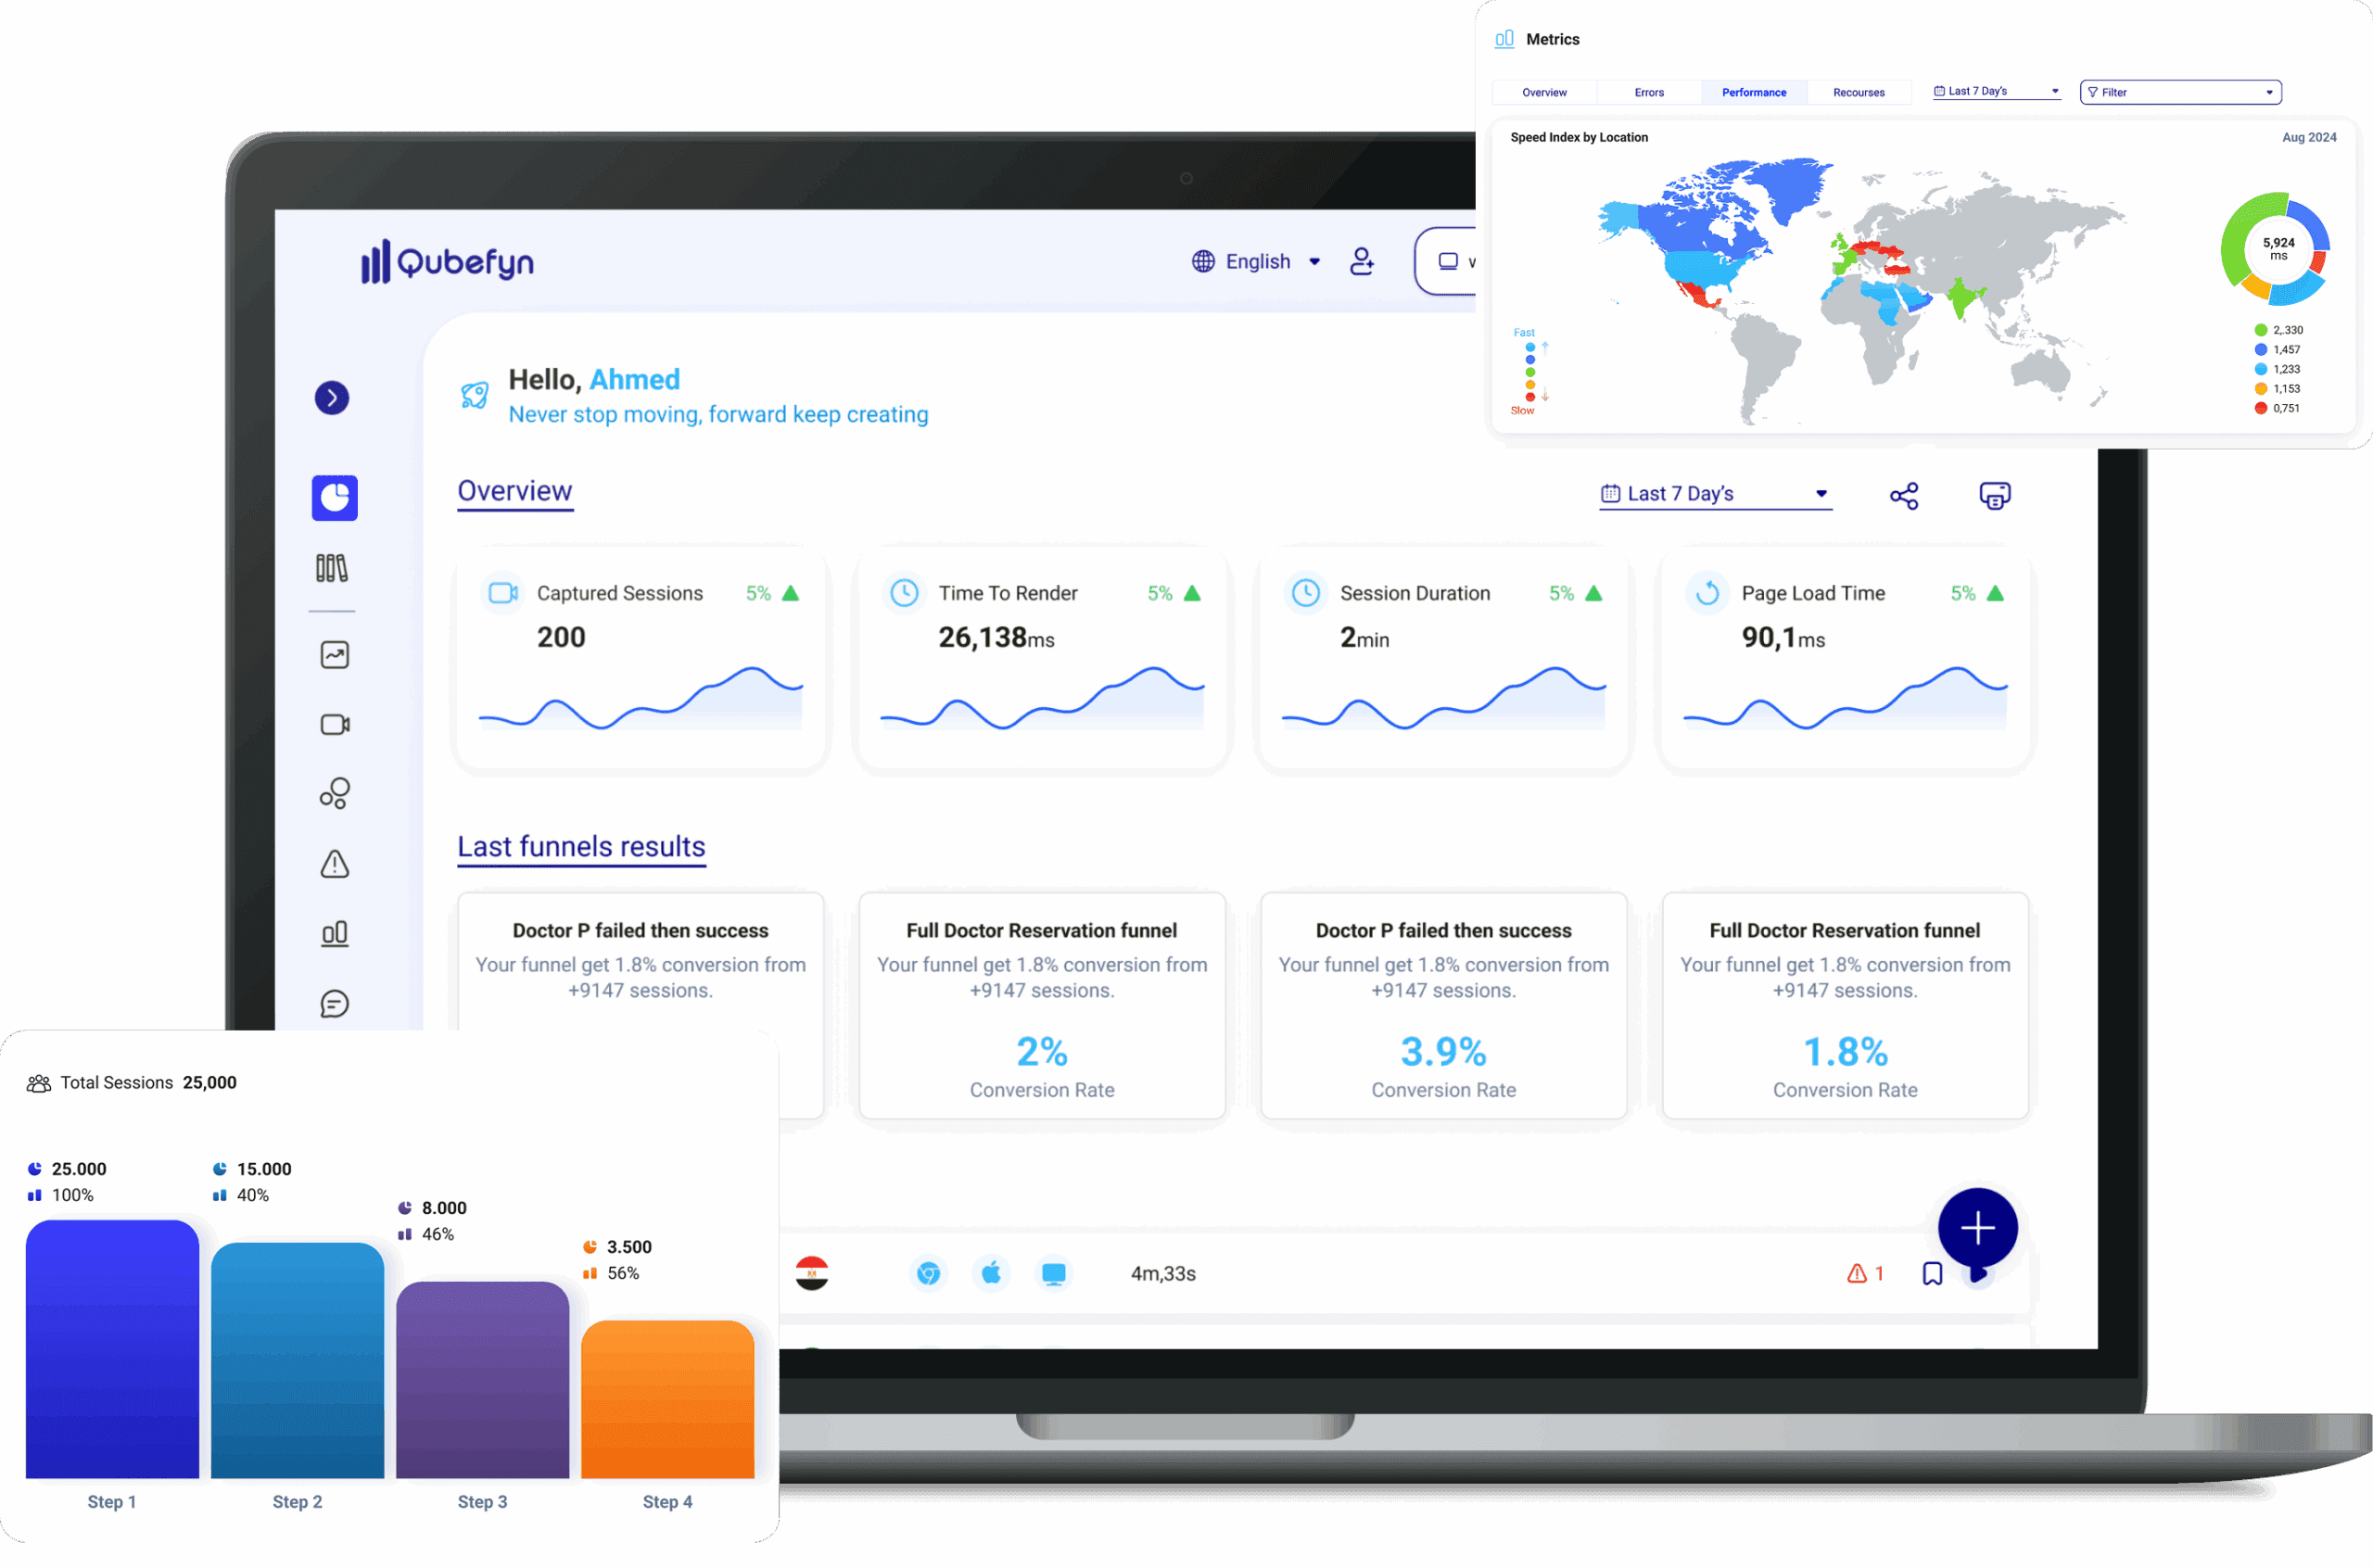
Metrics that guide decisions—not numbers that simply accumulate
A unified dashboard for visitor traffic, sources, engagement, and technical experience performance, with filters that give each team the view it needs.
From a raw signal to insight you can use.
Every component is designed to turn data or daily activity into a clearer decision your team can act on and review.
Visitor tracking
Sessions, trends, and geographic regions across comparable time periods.
Source analysis
Identify the channels that bring quality and engagement, not just visits.
Engagement metrics
Browsing time, depth, and goals in one context.
Technical performance
Speed, responsiveness, and resource consumption by device and page.
What are Metrics in Qube Analytics?
Metrics are current measurements that describe your site's performance, failures, and user behavior.
Technical analytics for a better-informed experience
Review page speed, visitor counts, errors, and related signals from one unified dashboard.
Earlier detection
Monitoring system metrics can surface performance issues before they become widespread.
Key performance signals in one place
Get a clear, current view of site performance. The Qube Analytics dashboard brings key metrics and trends together so teams can investigate the experience and make informed decisions.
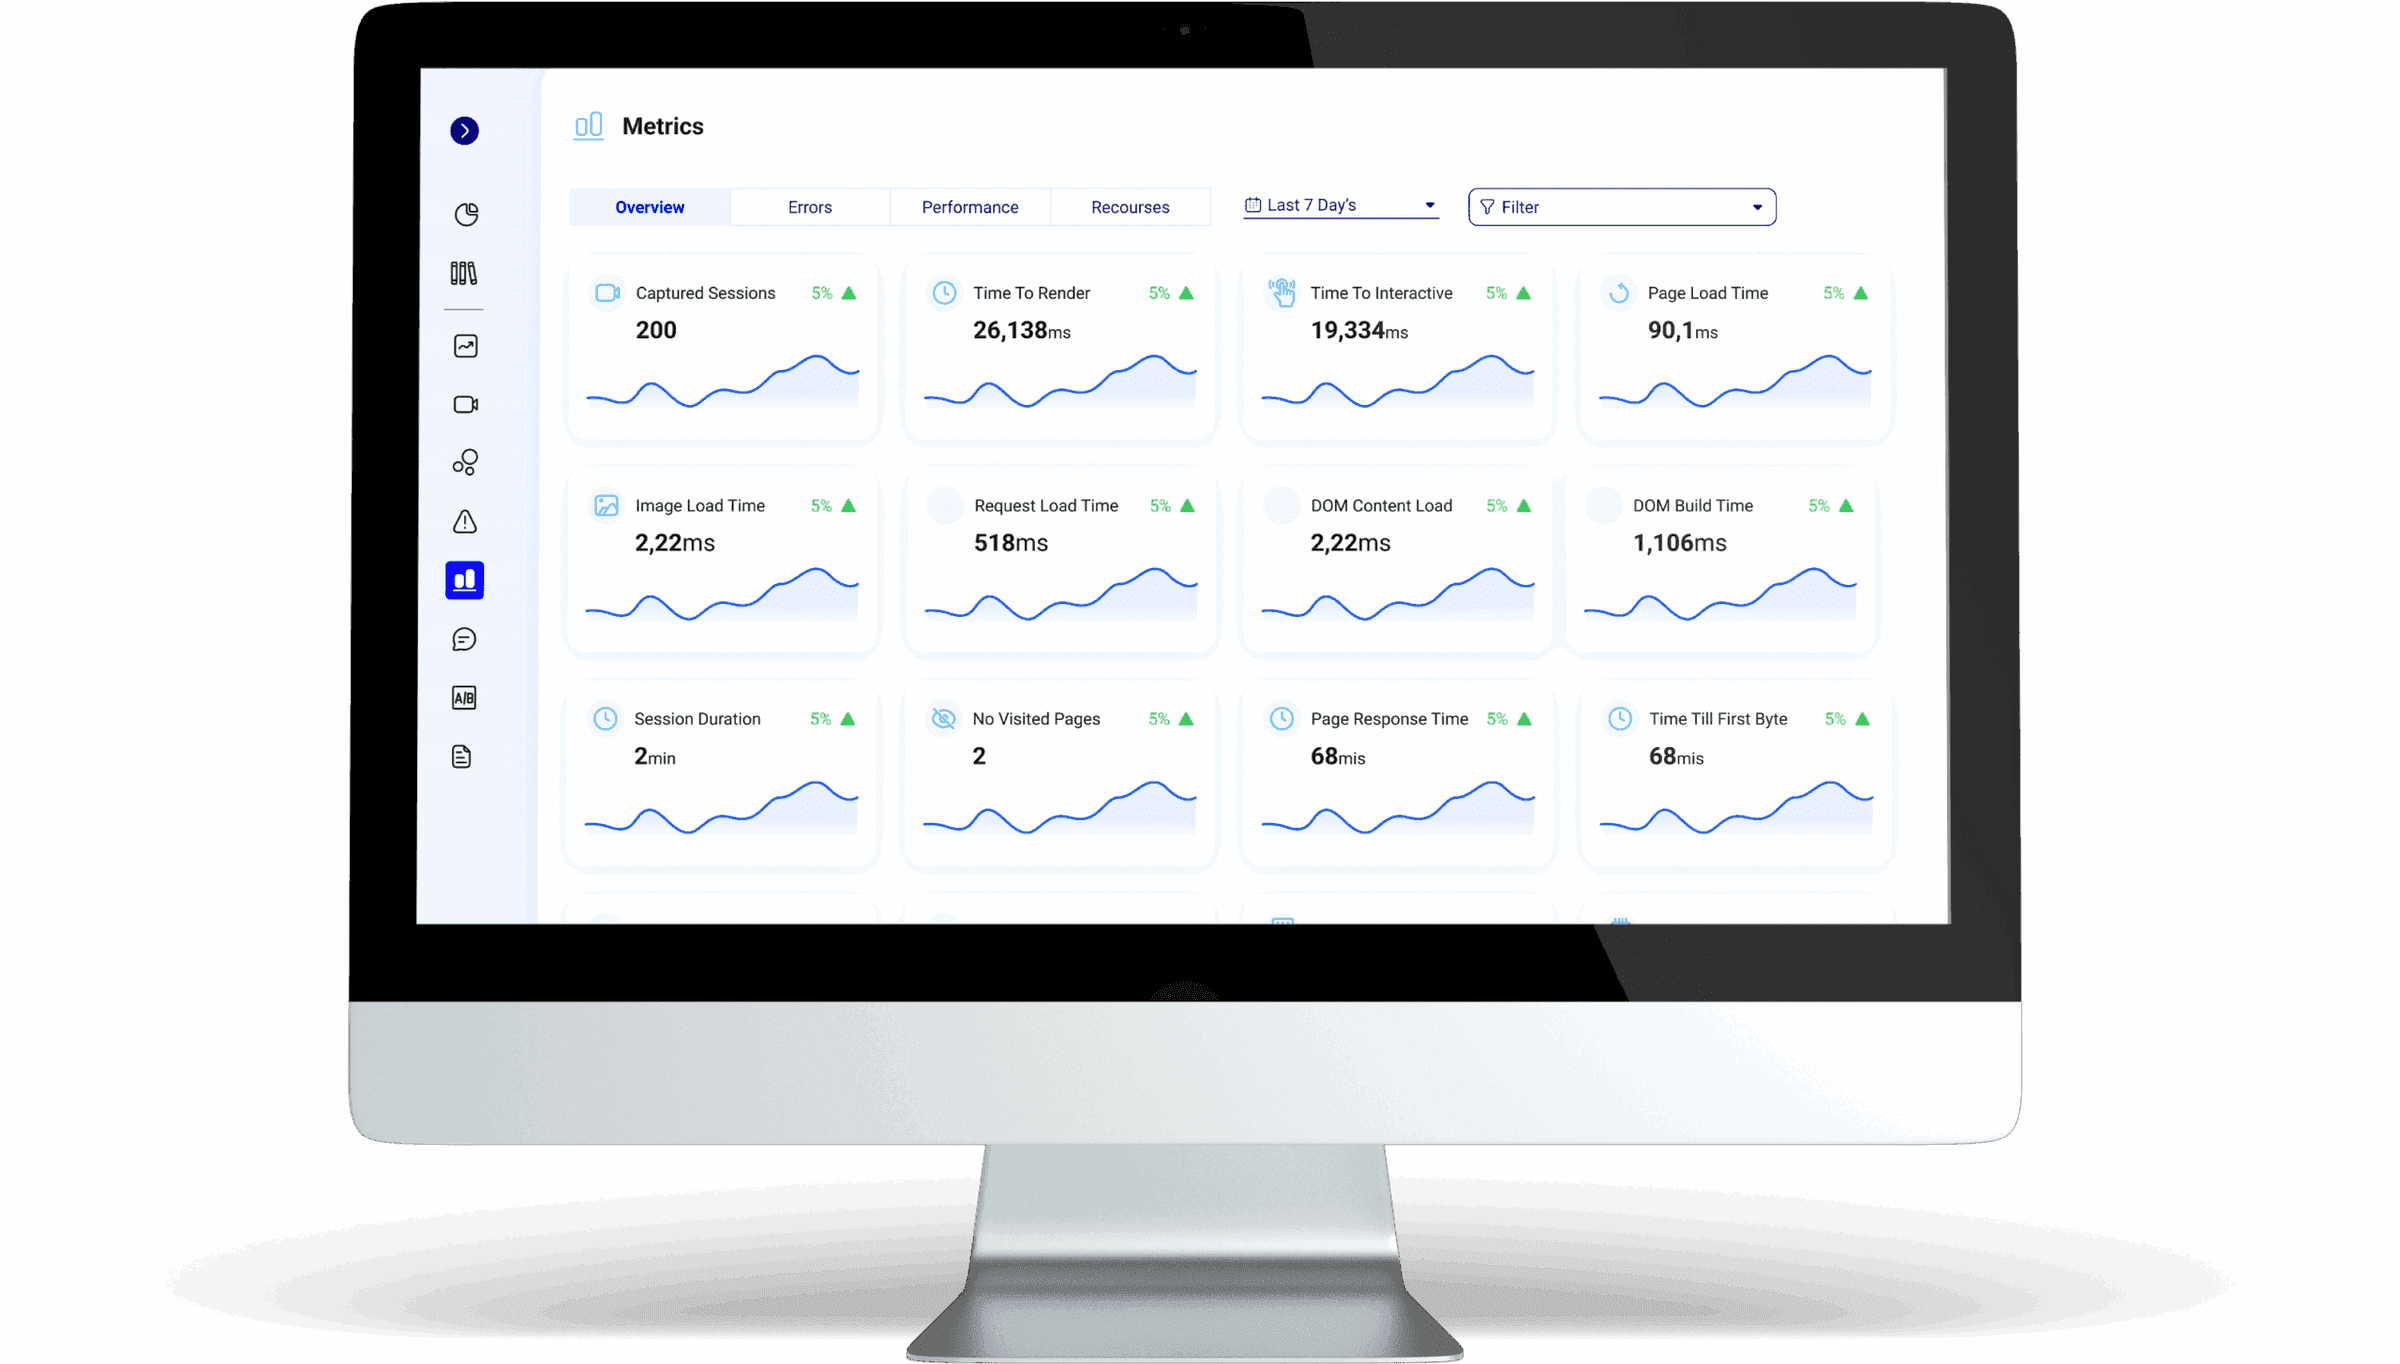
Sessions Captured
Track the total number of user sessions on your site.
Time To Interactive
Measure how quickly your site responds to user interaction.
Average page loading time
Understand how quickly your site pages load.
Average session duration
Find out how long users spend on your site.
Average pages visited
Analyze the number of pages users browse in one session.
Page response time
Monitor the time it takes the server to respond to the page request.
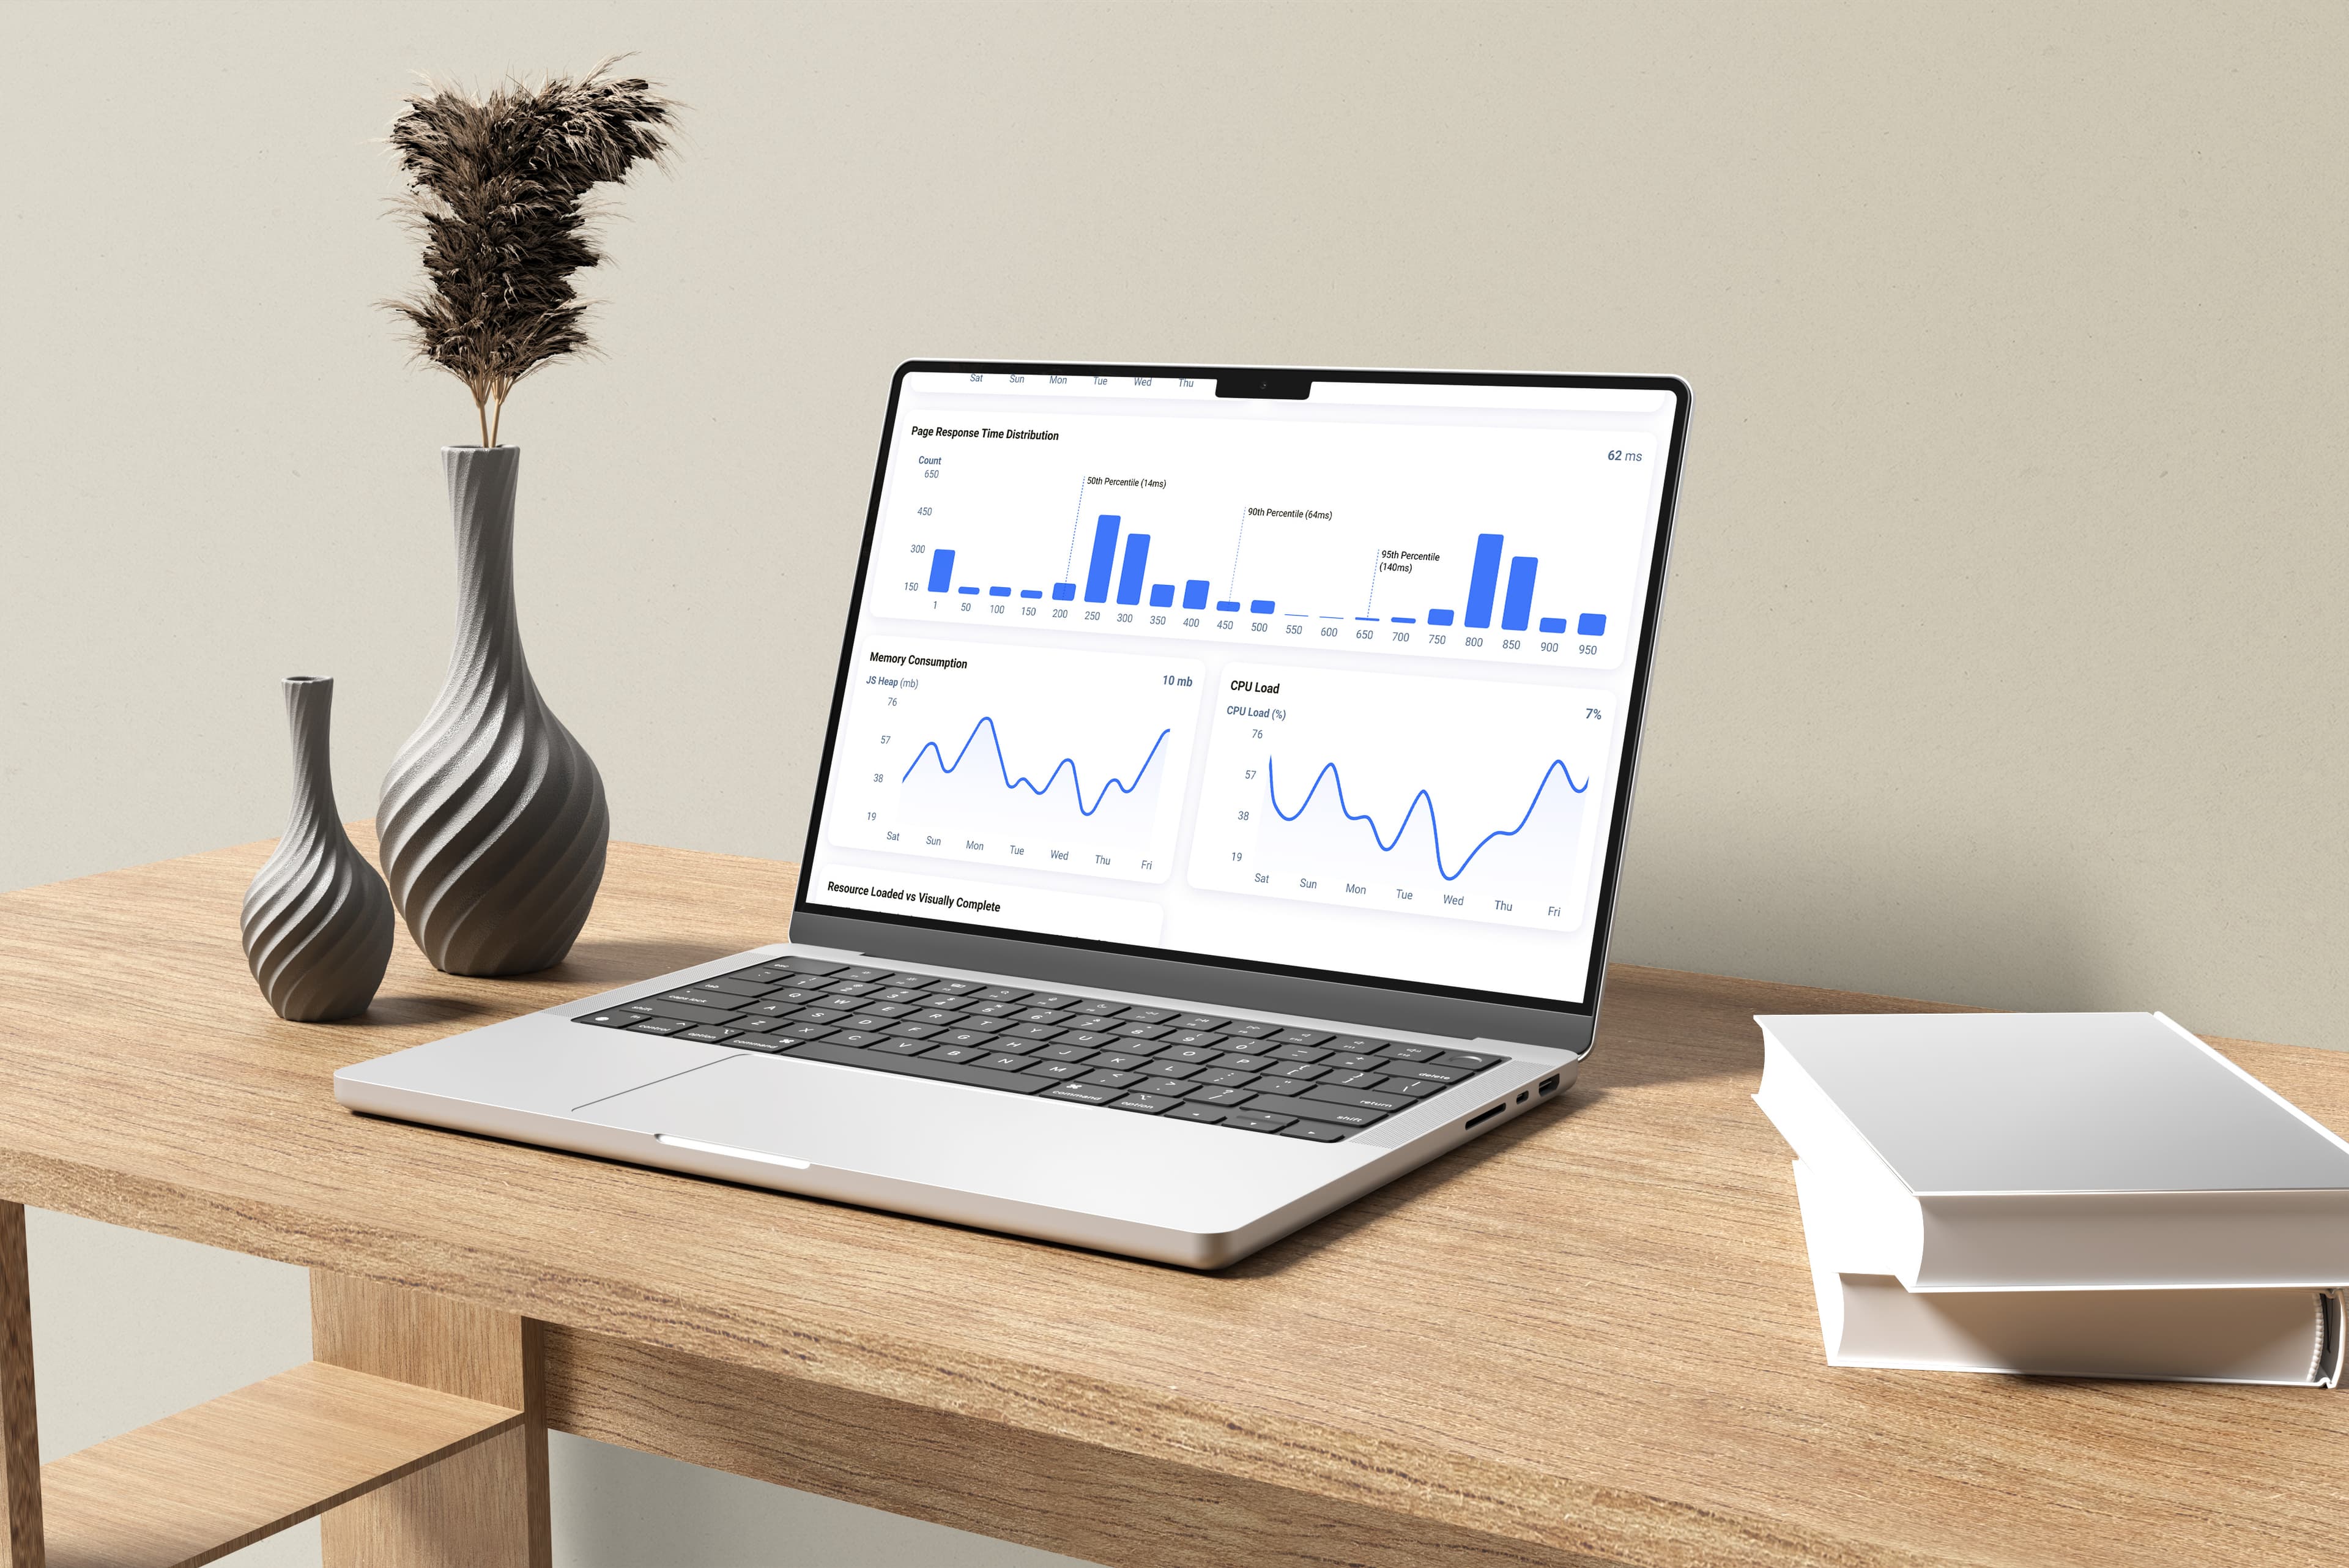
Memory consumption
Track memory usage to identify any performance issues.
CPU load
Understand the pressure on a user's CPU while browsing your site.
Frame Rate
Measure the smoothness of the visual user experience on your site.
Analysis of errors and technical problems
Affected sessions
Track sessions affected by errors such as JavaScript errors.
Errors by type
Categorize errors by problem type to identify recurring patterns.
Errors by source
Know the source from which errors within the site came.
Domains causing the most errors
Identify the domains associated with the highest number of errors.
Slowest domains
Find the domains contributing the most to loading delays.
Performance and resource metrics in Qube Analytics — original product view 1
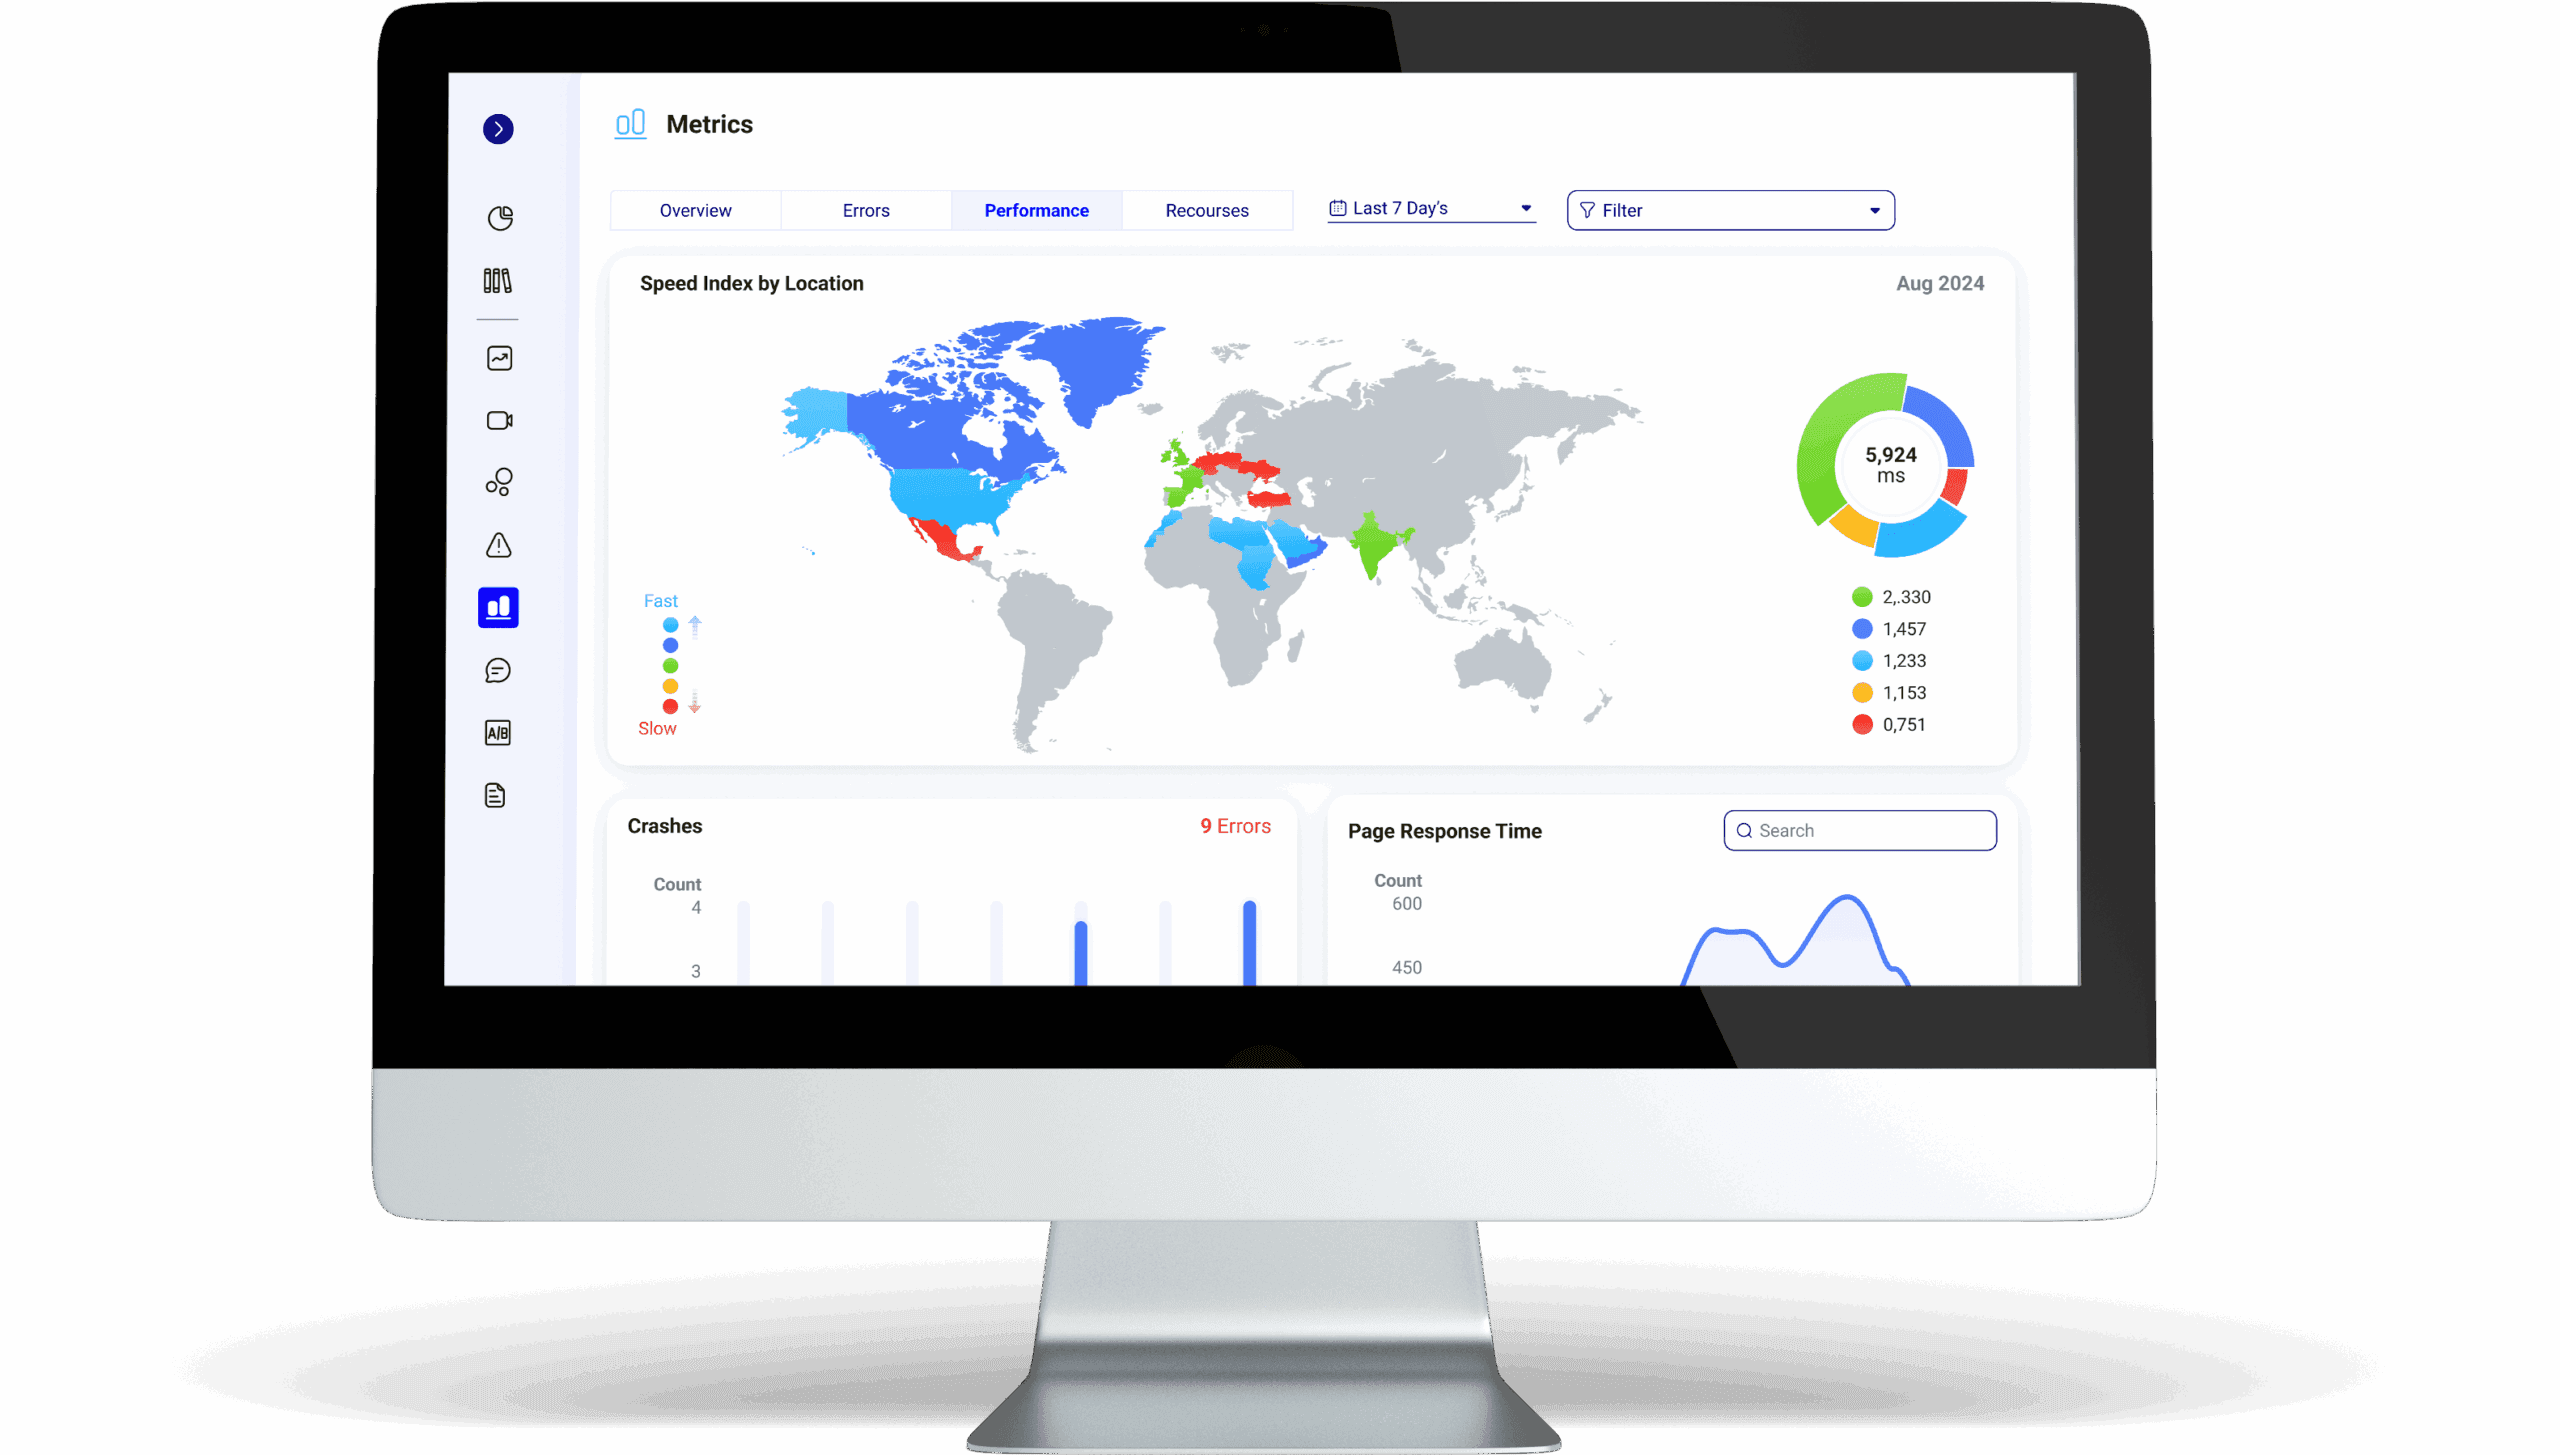
Analyze the speed and performance of your site around the world
Dive into the data for each country individually. Click on any country in the interactive map to see its detailed performance statistics.
Speed index by geographic location
Compare the speed of the experience between different geographical locations.
Crashes
Review crash events that appear in each market or country.
Page response time
Measure page response time in each location.
Sessions affected by slow requests
Find out how many sessions are affected by slow-responding requests.
Slowest domains
Identify the domains that add the most loading time.
Memory consumption and processor load
Monitor memory consumption and CPU load.
Page response time distribution
Look at the distribution of response times instead of relying on the average alone.
Loaded resources versus visual completeness
Compare the completion of resource loading with the moment when the page becomes visually complete.
Resource analysis
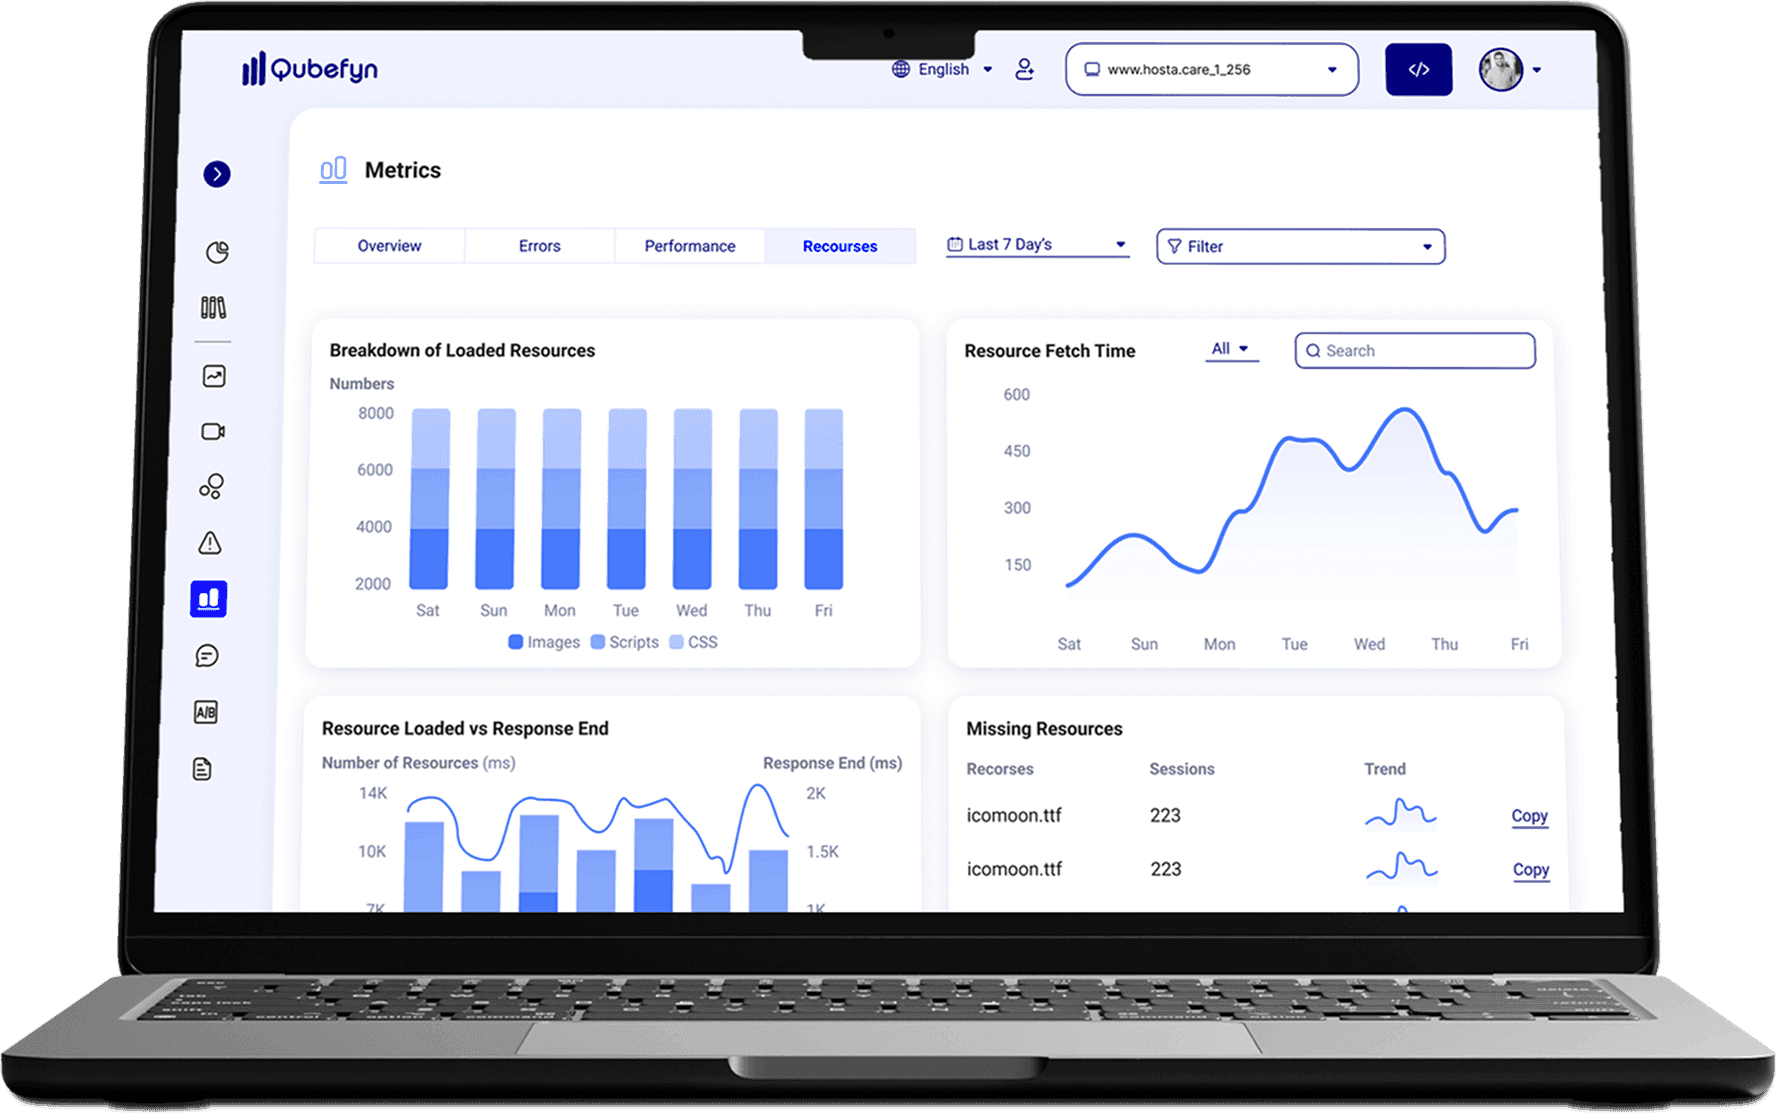
Distribution of loaded resources
Know the types of loaded resources and their distribution within the page.
Time to fetch resources
Measure the time required to fetch the resources the page depends on.
Missing resources
Identify resources that failed to load or are no longer available.
Slowest resources
Find out which resources take the longest to load.
Performance and resource metrics in Qube Analytics — original product view 2
Why do you need to track metrics?
Metrics provide current evidence about site performance, failures, and user behavior.
Detect problems early
Surface early signals before a performance issue becomes widespread.
Improve speed and stability
Use performance indicators to identify opportunities to improve site speed and stability.
Data-driven decisions
Make decisions based on real data rather than impressions.
Technical monitoring of visitor experience
Monitor the technical signals that shape the visitor experience.
Explore site performance through clear, consistent metrics
Track visitors
Understand the behavior of your visitors.
Source analysis
Know where your visitors are coming from.
Engagement metrics
Measure your audience's engagement with the content.
Evidence-backed decisions
Make data-driven development decisions.
Performance and resource metrics in Qube Analytics — original product view 3
Who can benefit from Metrics?
Metrics give technical and business teams a shared set of signals for more informed decisions.
Business managers and company owners
Monitor KPIs to evaluate progress and identify areas that may support business goals.
Sales teams
Understand pre-purchase behavior, compare visitor paths, and investigate barriers to completing a deal.
Analysts and data experts
Conduct deeper analysis, identify patterns, and make evidence-backed recommendations.
SEO teams
Monitor loading speed, resource performance, and crawl-related signals to investigate technical issues relevant to search visibility.
Website developers
Analyze resource performance, page loading speed, and memory consumption, and discover hidden problems in the code.
How do metrics help you make better decisions?
Metrics help teams investigate the user experience, loading time, crashes, and server performance before small issues become larger operational problems.
Don't rely on intuition
Data reveals what you cannot see with the naked eye.
Monitor performance by device
Different devices may change the entire experience.
Resolve problems early
Catching errors early saves effort and money.
Shared value, in every team's language.
Frequently asked questions about Metrics
Answers about metrics, performance, personalization, and privacy.
01What is the difference between Metrics and Analytics?+
Metrics are measured values such as load time, visitor count, or error count. Analytics is the process of interpreting those values and related context to understand behavior and support decisions.
02How do I benefit from knowing the page loading time?+
Loading time can influence usability and conversion. Comparing it across pages, devices, and journeys helps teams find where performance work may have the most value.
03Why is it important to know which countries or devices visitors use?+
This data helps you improve the user experience based on device type, connection speed, or language, which enhances engagement with your site.
04What should I do if I discover a high rate of errors?+
Use filters such as operating system, browser, or page to narrow the issue, then share the available context with the development team for investigation.
05Can I customize the metrics dashboard based on my priorities?+
Yes, you can rank metrics, choose what you think is important, and create custom dashboards that fit your goals.
06Do the metrics cover private or protected pages on my site?+
If the tracking code is present, those pages can be measured. Configure consent, masking, access, and retention controls to match your privacy requirements.
Let us connect the challenge to the right solution.
A short session to understand the context and identify the first experiment that can demonstrate real value.